Bitcoin Market Absorbs Supply In Batches: VDD Highlights Mature Bull Phase
Bitcoin is currently at a crossroads, caught between bullish hopes and bearish pressure. Bulls are struggling to reclaim the $115K level, while bears have been unable to keep BTC below $110K, leaving the market in a tens...
Archive context
Older archive item. Useful for background and entity history, but not a fresh market-moving signal.

Bitcoin is currently at a crossroads, caught between bullish hopes and bearish pressure. Bulls are struggling to reclaim the $115K level, while bears have been unable to keep BTC below $110K, leaving the market in a tense state of uncertainty. This indecision comes as volatility increases ahead of the upcoming US Federal Reserve meeting, where investors expect a possible announcement on interest rate cuts. Such a decision could significantly impact risk assets, including Bitcoin, by shaping liquidity conditions in global markets.
Top analyst Axel Adler highlights that as of today, it has been 504 days since the last halving, a milestone that places the market in a mature phase of the bull regime. By comparing the current cycle with the previous two, Adler suggests that Bitcoin is showing characteristics consistent with late-cycle behavior. While this phase often brings heightened volatility and profit-taking, it also underscores the broader strength of the cycle, supported by institutional demand and long-term adoption trends.
Bitcoin Redistribution Patterns Signal A Sustainable CycleAdler explains that in this cycle, Bitcoin has displayed a unique redistribution pattern compared to past bull runs. In March, when BTC traded near $70,000, the market witnessed an extreme spike in Value Days Destroyed (VDD), a signal of significant long-term holder (LTH) activity. This was followed by two additional, but more moderate, distribution waves near $98,000 and $117,000. Importantly, these later waves did not surpass the March extremum, suggesting that selling pressure from LTHs has been segmented and less overwhelming than in prior cycles.
This behavior points toward more sustainable redistribution, primarily due to institutional demand. Rather than one explosive top driven by panic or retail frenzy, supply is exiting in batches after each new all-time high. Institutional buyers, ETFs, and corporate treasuries are absorbing this selling, which spreads peaks across a longer period and creates stretched-out cycle dynamics.
Looking ahead, final conclusions about the cycle’s ultimate peak hinge on the emergence of the Peak Flag, a well-established late-cycle signal. The Peak Flag is triggered when the spot price trades at roughly 11 times higher than the LTH realized price. Historically, this ratio indicates that the market price has far outpaced the steadily climbing base cost of long-term holders.
Based on current trajectories, the nearest window for such a setup is October–November 2025. However, this depends on conditions aligning: a surge in major LTH spending, a spike in short-term volatility, and then a gradual fading of that volatility.
Price Testing Short-Term ResistanceBitcoin is trading at $112,952, staging a rebound after holding above the $110K support zone. The chart shows BTC attempting to build momentum, but clear resistance lies around $114K, in line with the 100-day moving average (green line). A sustained move above this level would be critical to validate further upside.
The 50-day moving average (blue line) is trending downward, currently acting as dynamic resistance and compressing price action. Until BTC reclaims it decisively, momentum remains fragile. On the downside, the 200-day moving average (red line) around $101,900 offers a deeper layer of long-term support, far below current levels.
Structurally, BTC is forming a short-term higher low compared to early September, hinting at stabilization. However, bulls face the challenge of reclaiming lost ground quickly before bears reassert pressure. The broader resistance zone between $115K and $117K will likely determine whether BTC continues its consolidation or mounts a stronger recovery attempt.
Holding above $110K keeps the bullish case intact, but without a breakout over $114K–$115K, Bitcoin risks slipping back into a choppy range. Traders should watch for volume confirmation on any breakout attempt.
Featured image from Dall-E, chart from TradingView
Why this matters
This bitcoin story adds another data point to the current market tape and is useful when read alongside nearby source coverage.
Original source
Read on NewsBTCRelated market context

Hyperliquid (HYPE) Price Prediction: Can Whale Buying and Binance Listing Drive HYPE to $210?
The technical setup for Hyperliquid price currently places $110, $130, $160, and $180 among the key levels to watch, while some tr...

XRP Price Prediction: October is a Weak Month for Ripple, But 3 Metrics Point Bullish
XRP is trading at $1.50, down 7.6% over the past 24 hours after reaching $1.63 during the period. Despite the pullback and a beari...

Streamex Converts Interest Into Capital as GLDY Investment Strategy Secures $1M+ Institutional Allocation
Miami, Florida, September 24th, 2026, Chainwire A Metalayer Capital strategy backed by an initial institutional allocation uses GL...

Solana hires ex-Binance CMO to boost institutional strategy
Solana's strategic hires aim to enhance institutional engagement, potentially boosting its market position and ecosystem growth lo...

Bullish clears longest-dated bitcoin options trade expiring in 2028
The execution of long-dated bitcoin options signals growing institutional confidence and maturity in the digital asset market infr...
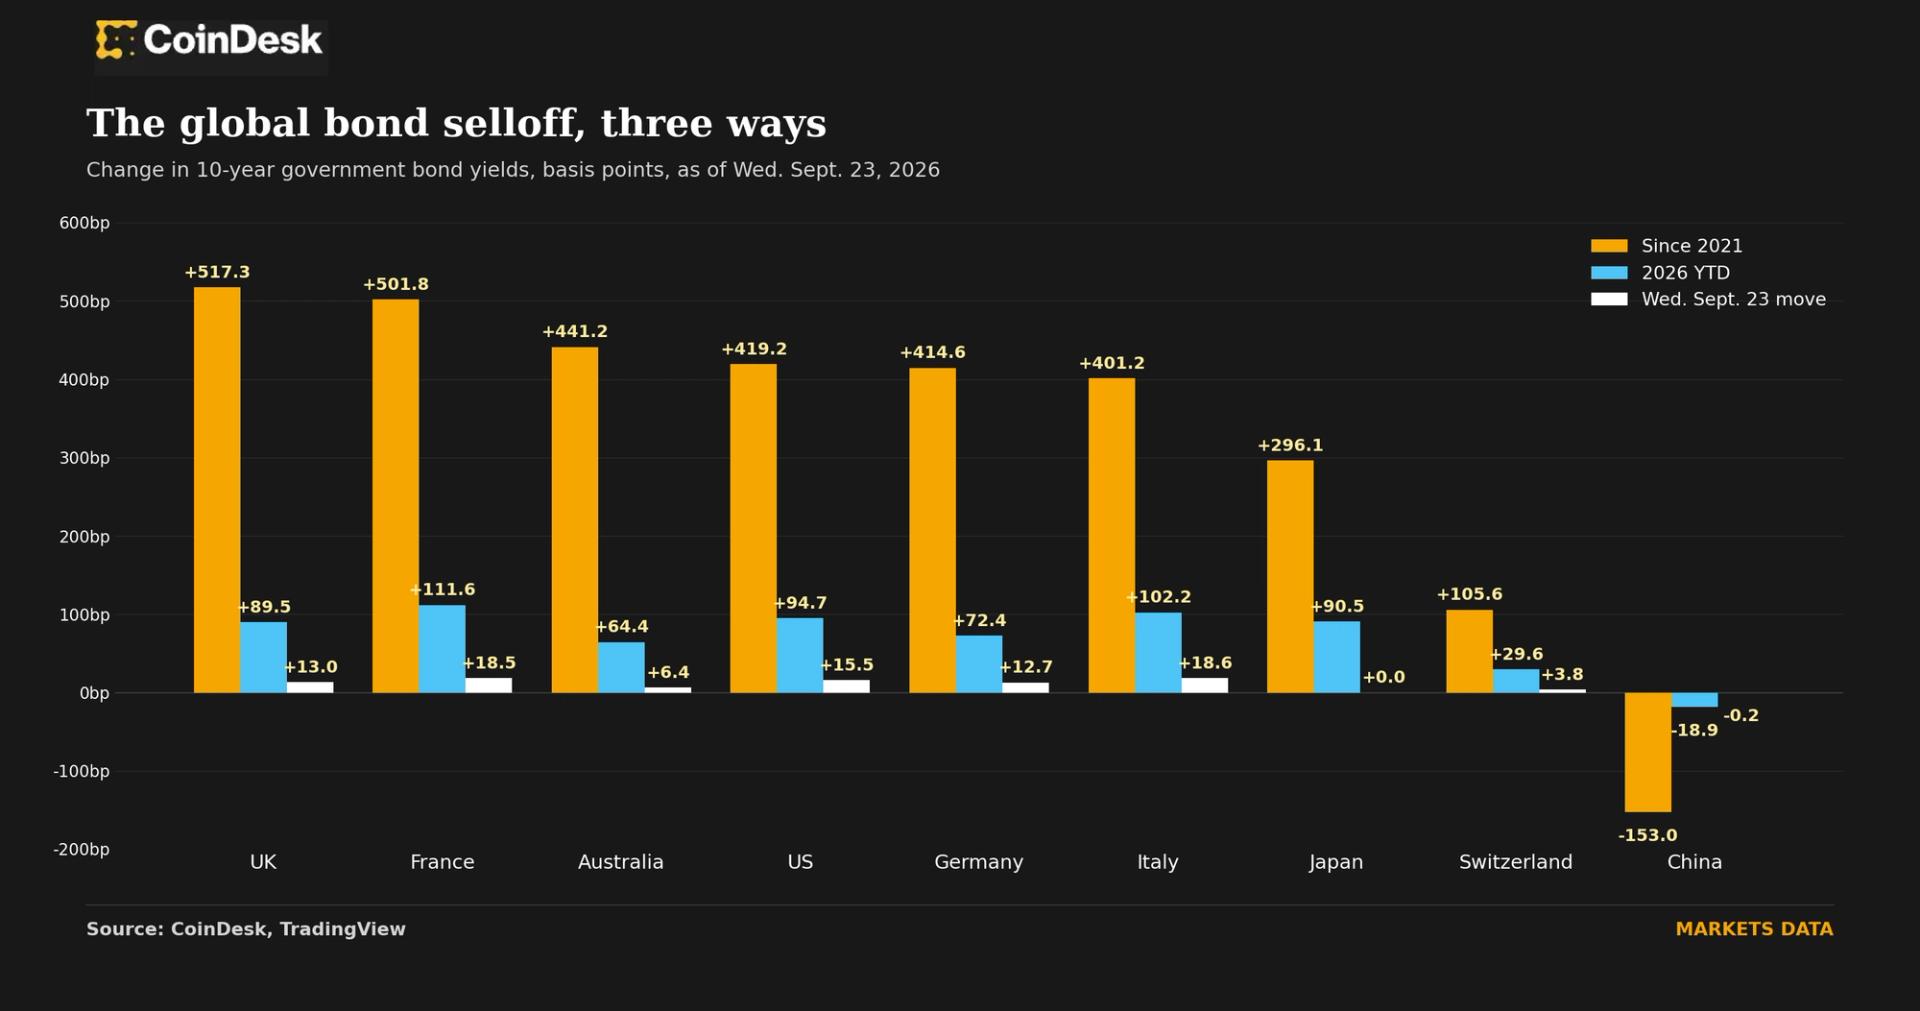
The data proves it: Bitcoin doesn't care about rising bond yields over long-term
Long-term, BTC ignores rising bond yields. In the short term, however, surging bond volatility could easily dampen crypto's animal...