Bitcoin Price Bleeds Lower With $65K Becoming The Battleground
Bitcoin price failed to stay above $70,000 and started another decline. BTC is now trading below $68,800 and might extend losses in the near term. Bitcoin is slowly moving lower below $68,800 and $68,000. The price is tr...
Archive context
Older archive item. Useful for background and entity history, but not a fresh market-moving signal.

Bitcoin price failed to stay above $70,000 and started another decline. BTC is now trading below $68,800 and might extend losses in the near term.
- Bitcoin is slowly moving lower below $68,800 and $68,000.
- The price is trading below $68,000 and the 100 hourly simple moving average.
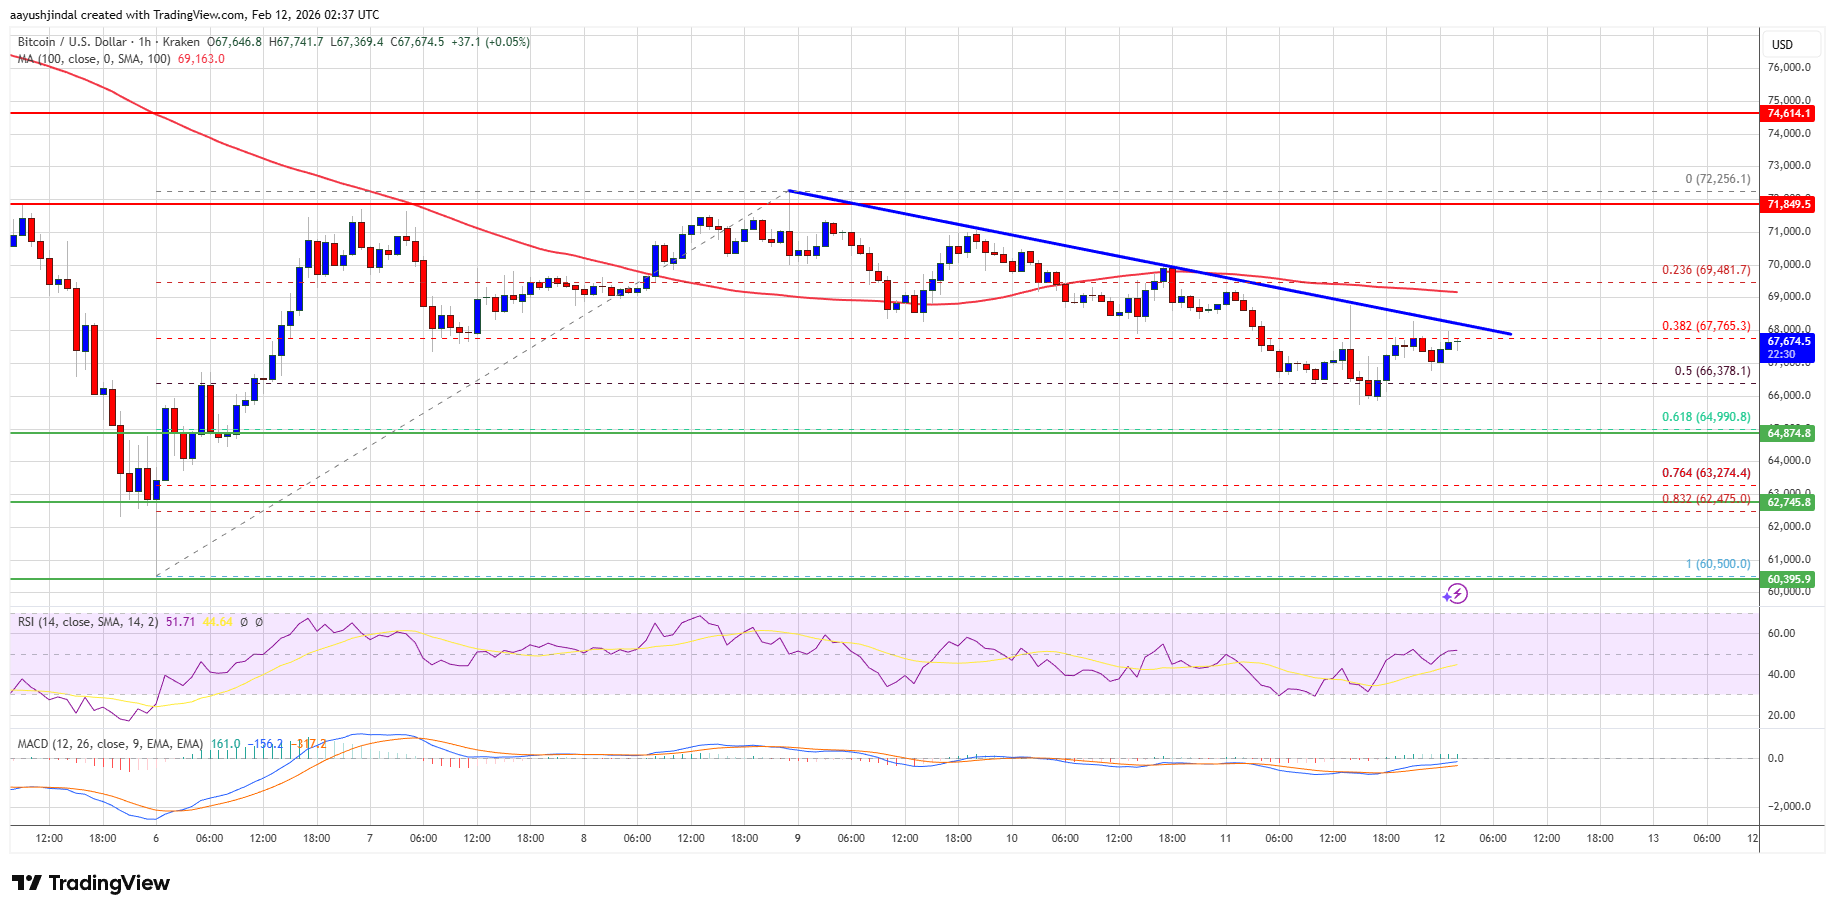
- There is a bearish trend line forming with resistance at $68,200 on the hourly chart of the BTC/USD pair (data feed from Kraken).
- The pair might dip again if it trades below the $66,500 and $65,000 levels.
Bitcoin price failed to remain stable above the $70,000 zone. BTC started a fresh decline and traded below the $68,800 support zone. There was a push below $68,000.
The price dipped below the 50% Fib retracement level of the upward move from the $60,500 swing low to the $72,256 high. There is also a bearish trend line forming with resistance at $68,200 on the hourly chart of the BTC/USD pair.
Bitcoin is now trading below $68,000 and the 100 hourly simple moving average. If the price remains stable above $65,000, it could attempt a fresh increase. Immediate resistance is near the $68,200 level and the trend line.
The first key resistance is near the $69,000 level. A close above the $69,000 resistance might send the price further higher. In the stated case, the price could rise and test the $70,000 resistance. Any more gains might send the price toward the $71,500 level. The next barrier for the bulls could be $72,000 and $72,500.
More Losses In BTC?If Bitcoin fails to rise above the $69,000 resistance zone, it could start another decline. Immediate support is near the $66,000 level. The first major support is near the $65,000 level or the 61.8% Fib retracement level of the upward move from the $60,500 swing low to the $72,256 high.
The next support is now near the $63,500 zone. Any more losses might send the price toward the $62,000 support in the near term. The main support now sits at $61,200, below which BTC might struggle to recover in the near term.
Technical indicators:
Hourly MACD – The MACD is now gaining pace in the bearish zone.
Hourly RSI (Relative Strength Index) – The RSI for BTC/USD is now below the 50 level.
Major Support Levels – $66,000, followed by $65,000.
Major Resistance Levels – $69,000 and $70,000.
Why this matters
Bitcoin is a tracked market entity in the DigitalMoneyBox archive, making this useful context for readers monitoring repeated mentions and follow-up coverage.
Original source
Read on NewsBTCRelated market context

Worldcoin (WLD) Price Prediction: Can Grayscale’s Worldcoin ETF Filing Trigger a WLD Rebound Above $0.45?
The filing has put the token back in focus at a time when WLD remains well below its recent 2026 highs and technical indicators co...

XRP Price Prediction: XRP Holds Above $1.14 as Bulls Battle to Reverse the Broader Downtrend
The move has improved the short-term technical picture, but the broader trend remains under pressure as XRP continues to trade bel...

Sky Protocol Revenue Nears $419M Annualized As USDS Demand Supports DeFi Income
Sky Protocol’s annualized gross revenue has climbed close to $419 million, according to its governance status dashboard, giving De...
Bitcoin Price Prediction: Bitcoin Volatility Hits 2016 Low, Could Trigger Liquidations
Bitcoin price is trading around $66,100, after climbing above $66,500 earlier in the session, in a bullish prediction environment....

Bitcoin breaks $66,000 but 4 key signals show this rally is far from normal
Bitcoin surged past $66,000 for the first time since early June, extending a recovery that is beginning to repair some of the loss...

XRP Price Could Turn Volatile This Month: What’s at Stake for Ripple?
XRP price is trading around $1.13, up about 2% over the past 24 hours. Those modest gains hide a much larger binary risk approachi...