Bitcoin Price Downtrend Gains Pace, Recovery Hopes Continue To Fade
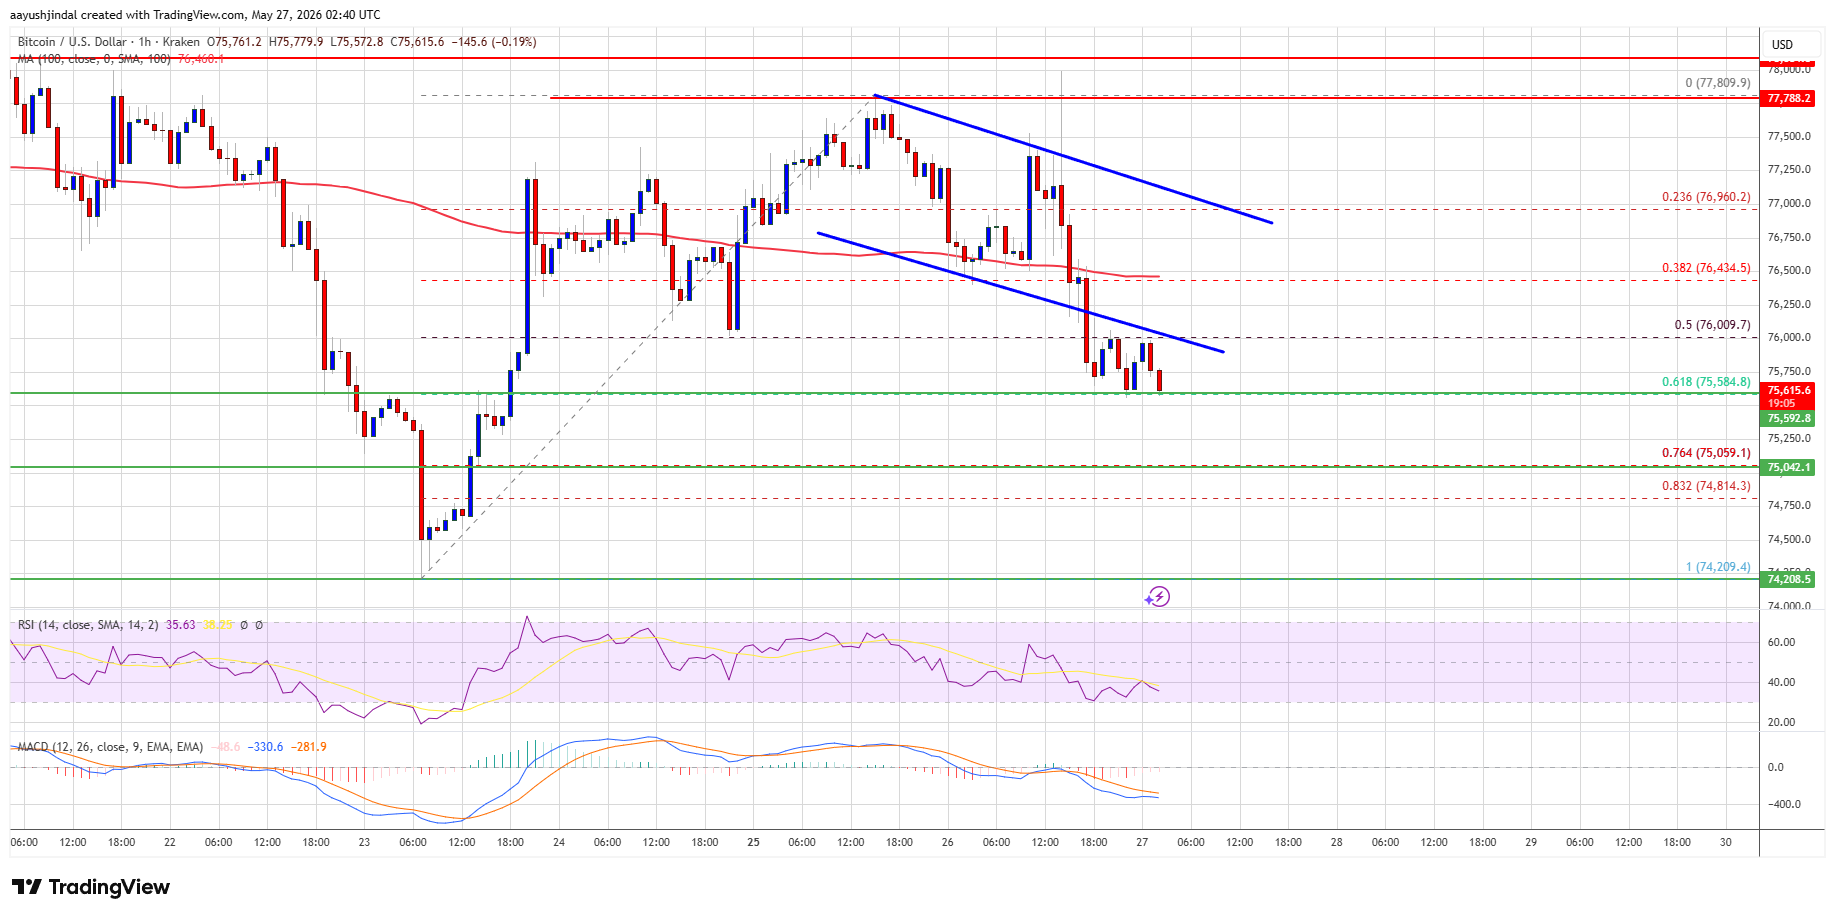
Bitcoin price started a downside correction from the $77,800 zone. BTC is showing bearish signs and might continue lower below $75,500. Bitcoin failed to stay above $77,000 and extended losses. The price is trading below...
Archive context
Older archive item. Useful for background and entity history, but not a fresh market-moving signal.

Bitcoin price started a downside correction from the $77,800 zone. BTC is showing bearish signs and might continue lower below $75,500.
- Bitcoin failed to stay above $77,000 and extended losses.
- The price is trading below $76,800 and the 100 hourly simple moving average.
- There was a break below a declining channel with support at $76,250 on the hourly chart of the BTC/USD pair (data feed from Kraken).
- The pair might extend losses if it stays below the $76,200 and $76,500 levels.
Bitcoin price failed to clear the $77,500 resistance zone. BTC started a downside correction and declined below the key support at $76,500 to enter a bearish zone.
There was a move below the 50% Fib retracement level of the upward move from the $74,210 swing low to the $77,810 high. Besides, there was a break below a declining channel with support at $76,250 on the hourly chart of the BTC/USD pair.
Bitcoin is now trading below $76,500 and the 100 hourly simple moving average. If the price remains stable above $75,500, it could attempt a fresh increase. Immediate resistance is near the $76,000 level. The first key resistance is near the $76,250 level.
A close above the $76,250 resistance might send the price further higher. In the stated case, the price could rise and test the $77,000 resistance. The next resistance could be near the $77,200 level. Any more gains might send the price toward the $78,000 level. The main hurdle for the bulls could be $79,500.
Downside Extension In BTC?If Bitcoin fails to rise above the $76,500 resistance zone, it could start another decline. Immediate support is near the $75,550 level or the 61.8% Fib retracement level of the upward move from the $74,210 swing low to the $77,810 high.
The first major support is near the $75,000 level. The next support is now near the $74,200 zone. Any more losses might send the price toward the $74,000 support in the near term. The main support now sits at $73,500, below which BTC might struggle to recover in the near term.
Technical indicators:
Hourly MACD – The MACD is now gaining pace in the bearish zone.
Hourly RSI (Relative Strength Index) – The RSI for BTC/USD is now below the 50 level.
Major Support Levels – $74,200, followed by $73,500.
Major Resistance Levels – $76,500 and $77,000.
Why this matters
Bitcoin is a tracked market entity in the DigitalMoneyBox archive, making this useful context for readers monitoring repeated mentions and follow-up coverage.
Original source
Read on NewsBTCRelated market context

Bitcoin (BTC) Price Today: Michael Saylor’s Strategy Reports $8.3B Loss as BTC Slides Below $64K
The BTC move comes shortly after Strategy reported an $8.33 billion operating loss for the second quarter of 2026, including an $8...

If Bitcoin breaks $62k over the weekend, a $1.1B short overhang stands ready to pull price down to $60k
Bitcoin enters the weekend near $62,900, less than 1% above the July 31 intraday low, and Deribit has already settled roughly $9.6...

Bitcoin (BTC) Price Prediction: TD Sequential Sell Signal and Weak August History Raise Pullback Risks
The latest market snapshots show Bitcoin trading near $63,000–$64,000, with traders watching whether support around $62,800 can ho...

Ethereum (ETH) Price Prediction: $2,000 or $1,680 Next as ETH Reaches a Critical Turning Point
Ethereum price has fallen back below $1,900 after buyers failed to maintain the latest recovery, leaving ETH positioned between an...

Bitcoin Price Prediction: Michael Saylor’s Strategy Posts Massive Q2 Loss Despite Bigger Bitcoin Stack
Bitcoin is trading around $63,000 to $65,000 price range, as Strategy’s weak Q2 earnings add pressure to an already cautious marke...

Bitcoin Price Prediction: $10 Billion of BTC and ETH Option Expiry Hitting the Market Today
The largest single-day options expiry in recent months is clearing today, and the market is already pricing in the friction. Bitco...