Bitcoin Price Extends Increase, Why Dips Turned Attractive In Short-Term
Bitcoin price extended its increase and climbed above the $66,000 resistance zone. BTC is now showing positive signs and might find bids near $65,500. Bitcoin gained pace for a move above the $65,500 resistance zone. The...
Archive context
Older archive item. Useful for background and entity history, but not a fresh market-moving signal.

Bitcoin price extended its increase and climbed above the $66,000 resistance zone. BTC is now showing positive signs and might find bids near $65,500.
- Bitcoin gained pace for a move above the $65,500 resistance zone.
- The price is trading above $65,500 and the 100 hourly Simple moving average.
- There is a key bullish trend line forming with support at $65,700 on the hourly chart of the BTC/USD pair (data feed from Kraken).
- The pair could correct lower, but the bulls might remain active near the $65,500 support.
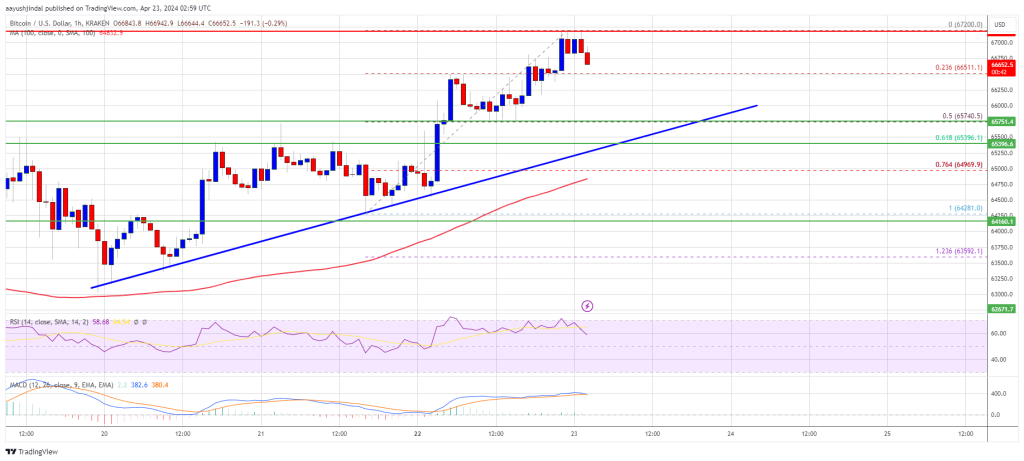
Bitcoin price started a fresh increase above the $64,500 and $65,000 resistance levels. BTC bulls even pushed the price above the $66,000 resistance. It traded to a new weekly high at $67,200 and is currently consolidating gains.
The price is slowly moving lower toward the 23.6% Fib retracement level of the upward move from the $64,281 swing low to the $67,200 low. Bitcoin price is still trading above $65,500 and the 100 hourly Simple moving average.
There is also a key bullish trend line forming with support at $65,700 on the hourly chart of the BTC/USD pair. The trend line is near the 50% Fib retracement level of the upward move from the $64,281 swing low to the $67,200 low.
Immediate resistance is near the $67,000 level. The first major resistance could be $67,200. The next resistance now sits at $68,500. If there is a clear move above the $68,500 resistance zone, the price could continue to move up. In the stated case, the price could rise toward $70,000.
Source: BTCUSD on TradingView.com
The next major resistance is near the $70,500 zone. Any more gains might send Bitcoin toward the $72,000 resistance zone in the near term.
Downside Correction In BTC?If Bitcoin fails to rise above the $67,000 resistance zone, it could start a downside correction. Immediate support on the downside is near the $66,500 level.
The first major support is $65,700 or the trend line. If there is a close below $65,500, the price could start to drop toward $65,000. Any more losses might send the price toward the $64,200 support zone in the near term.
Technical indicators:
Hourly MACD – The MACD is now losing pace in the bullish zone.
Hourly RSI (Relative Strength Index) – The RSI for BTC/USD is now above the 50 level.
Major Support Levels – $66,500, followed by $65,500.
Major Resistance Levels – $67,000, $67,200, and $68,500.
Why this matters
This bitcoin story adds another data point to the current market tape and is useful when read alongside nearby source coverage.
Original source
Read on NewsBTCRelated market context

XRP Price Prediction: XRP Faces Critical Resistance Near $1.17 Despite Ripple Securing Landmark EU License
While the company secured a full MiCA license that expands its operations across the European Economic Area, market indicators sug...

Ethereum Price Stabilizes as Tether Burns $2.5 Billion USDT Stablecoins
Ethereum is slipping by more than 2% as massive $2.5 billion USDT burn on Ethereum dragged its price prediction down. Although ETH...

Ethereum’s treasury boom now has one company nearing 5% of supply
Ethereum treasury company BitMine said it now holds 5,742,237 ETH, or 4.8% of Ethereum's (ETH) 120.7 million token supply, putting...

Sam Altman ChatGPT AI Predicts Insane Bitcoin Price by 2026
Sam Altman ChatGPT AI just circled November on the calendar and put a number next to Bitcoin Price Prediction. The model predicts...

Crypto News, July 8: U.S. Strikes Iran Again, Ethereum Price Wobbles After Bitcoin Spot Sell-Off
Crypto markets woke up to fresh news as U.S. strikes hit Iran again. The Bitcoin price is stuck chopping between $62,000 and $64,5...

Ethereum is losing ownership of crypto payments as Base moves $565B in stablecoins
Stablecoin activity is becoming a contest over which blockchains move the most tokenized dollars. Visa Onchain Analytics showed th...