Bitcoin Price Primed To Clear $71,500 and Rally Again
Bitcoin price is again rising above the $70,000 resistance zone. BTC seems to be setting up for a steady increase above the $71,500 resistance zone. Bitcoin price is climbing higher and above the $70,000 resistance zone....
Archive context
Older archive item. Useful for background and entity history, but not a fresh market-moving signal.

Bitcoin price is again rising above the $70,000 resistance zone. BTC seems to be setting up for a steady increase above the $71,500 resistance zone.
- Bitcoin price is climbing higher and above the $70,000 resistance zone.
- The price is trading above $70,500 and the 100 hourly Simple moving average.
- There is a crucial bullish trend line forming with support at $70,200 on the hourly chart of the BTC/USD pair (data feed from Kraken).
- The pair could soon start a fresh rally if it clears the $71,500 resistance zone.
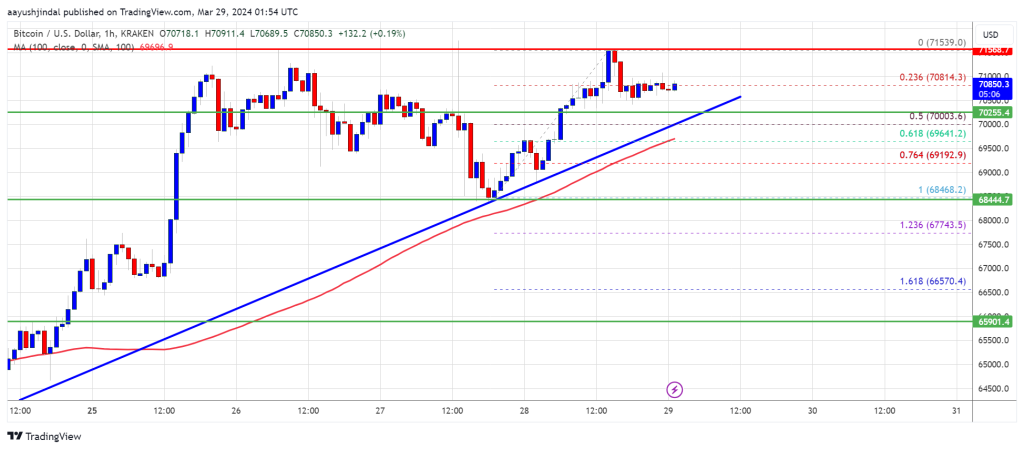
Bitcoin price remained well-supported above the $69,000 resistance zone. BTC climbed higher the $70,000 resistance zone to move again into a positive zone.
The price broke the $71,000 level and retested $71,500. A high was formed near $71,539 and there was a downside correction. There was a minor decline below the 23.6% Fib retracement level of the upward move from the $68,468 swing low to the $71,539 high.
Bitcoin is now trading above $70,000 and the 100 hourly Simple moving average. There is also a crucial bullish trend line forming with support at $70,200 on the hourly chart of the BTC/USD pair.
Source: BTCUSD on TradingView.com
Immediate resistance is near the $71,200 level. The first major resistance could be $71,500. If there is a clear move above the $71,500 resistance zone, the price could start a strong increase. In the stated case, the price could even clear the $72,500 resistance zone in the near term. The next major resistance is near the $73,500 zone.
Another Decline In BTC?If Bitcoin fails to rise above the $71,500 resistance zone, it could start another decline. Immediate support on the downside is near the $70,200 level and the trend line.
The first major support is $70,000 and the 50% Fib retracement level of the upward move from the $68,468 swing low to the $71,539 high. The next support sits at $69,200. If there is a close below $69,200, the price could start a drop toward the $68,000 level. Any more losses might send the price toward the $66,500 support zone in the near term.
Technical indicators:
Hourly MACD – The MACD is now gaining pace in the bullish zone.
Hourly RSI (Relative Strength Index) – The RSI for BTC/USD is now above the 50 level.
Major Support Levels – $70,200, followed by $69,200.
Major Resistance Levels – $71,200, $71,500, and $73,500.
Why this matters
This bitcoin story adds another data point to the current market tape and is useful when read alongside nearby source coverage.
Original source
Read on NewsBTCRelated market context
Solana’s $8.7B RWA surge shows tokenized assets are finally starting to move
Solana’s real-world asset transfer volume more than doubled over the past month, giving the network a stronger signal that tokeniz...

Ethereum Price Stabilizes as Tether Burns $2.5 Billion USDT Stablecoins
Ethereum is slipping by more than 2% as massive $2.5 billion USDT burn on Ethereum dragged its price prediction down. Although ETH...

XRP Reclaims A Key Support Zone As Traders Watch Open Interest Build
XRP has moved back into a zone traders are watching closely, with the $0.50 area acting as the line that decides whether the lates...

Cardano Price Prediction: ADA Pulls Back to $0.17 After a Strong Weekly Rally as Bulls Watch $0.20 and $0.22 Reclaim
Cardano price is trading near $0.17 after a weaker 24-hour session, according to Brave New Coin data. ADA is down around 4.84% on...

Sam Altman ChatGPT AI Predicts Insane Bitcoin Price by 2026
Sam Altman ChatGPT AI just circled November on the calendar and put a number next to Bitcoin Price Prediction. The model predicts...

Hedge Funds Are Most Bearish onYen Since 2007: Could Japan Rotation Send XRP to $2.00?
XRP News: XRP is trading around $1.07, down roughly 3% over the past 24 hours, but still carrying a 6–7% weekly gain that keeps th...