Bitcoin Price Retreats From Highs – Is The Market Signaling A Short-Term Top?
Bitcoin price struggled to surpass $126,200 and corrected gains. BTC is now consolidating near $122,000 and might aim for a recovery wave. Bitcoin started a downside correction below the $125,000 level. The price is trad...
Archive context
Older archive item. Useful for background and entity history, but not a fresh market-moving signal.

Bitcoin price struggled to surpass $126,200 and corrected gains. BTC is now consolidating near $122,000 and might aim for a recovery wave.
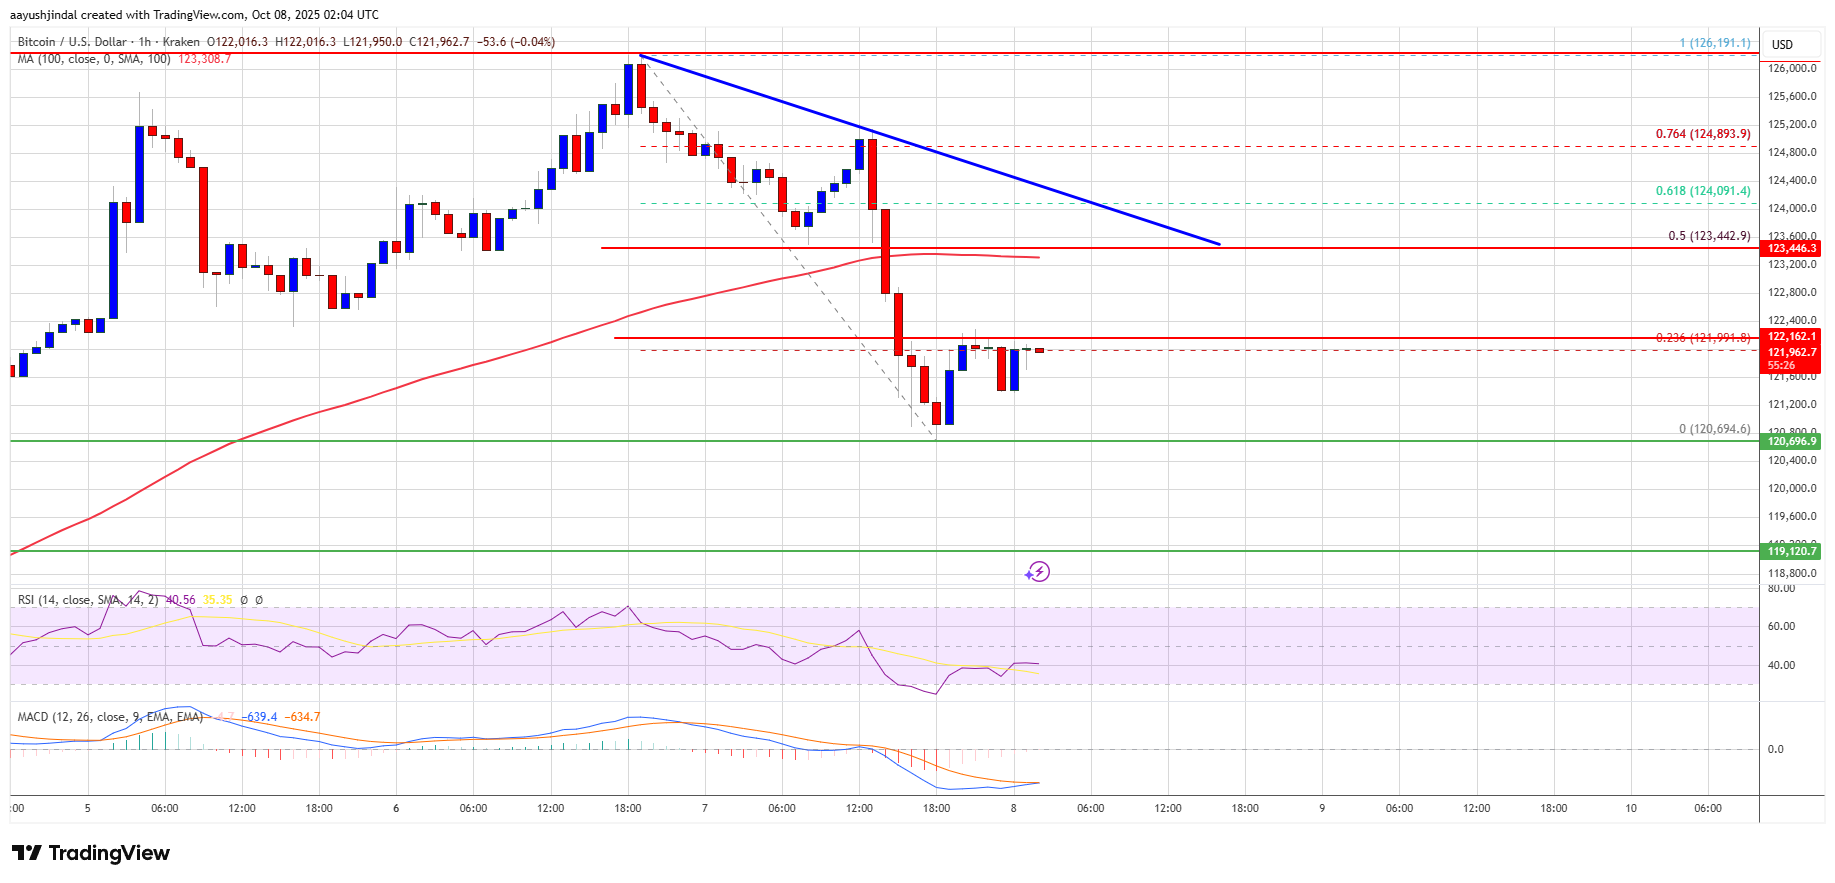
- Bitcoin started a downside correction below the $125,000 level.
- The price is trading below $124,000 and the 100 hourly Simple moving average.
- There is a key bearish trend line forming with resistance at $123,500 on the hourly chart of the BTC/USD pair (data feed from Kraken).
- The pair might continue to move down if it trades below the $120,500 zone.
Bitcoin price extended gains above the $124,000 zone. BTC climbed above the $125,000 and $125,500 resistance levels before the bears appeared.
A new high was formed at $126,198 before there was a downside correction. The price dipped below the $124,000 support zone. There was a sharp move and the price tested the $120,500 region. The price is now consolidating near the 23.6% Fib retracement level of the recent decline from the $126,191 swing high to the $120,694 low.
Bitcoin is now trading below $124,000 and the 100 hourly Simple moving average. Besides, there is a key bearish trend line forming with resistance at $123,500 on the hourly chart of the BTC/USD pair.
Immediate resistance on the upside is near the $122,250 level. The first key resistance is near the $123,500 level and the trend line. It is close to the 50% Fib level of the recent decline from the $126,191 swing high to the $120,694 low.
The next resistance could be $124,200. A close above the $124,200 resistance might send the price further higher. In the stated case, the price could rise and test the $125,500 resistance. Any more gains might send the price toward the $126,000 level. The next barrier for the bulls could be $126,200.
More Losses In BTC?If Bitcoin fails to rise above the $123,500 resistance zone, it could start a fresh decline. Immediate support is near the $121,200 level. The first major support is near the $120,500 level.
The next support is now near the $118,500 zone. Any more losses might send the price toward the $116,200 support in the near term. The main support sits at $115,500, below which BTC might struggle to recover in the short term.
Technical indicators:
Hourly MACD – The MACD is now losing pace in the bullish zone.
Hourly RSI (Relative Strength Index) – The RSI for BTC/USD is now below the 50 level.
Major Support Levels – $121,200, followed by $120,500.
Major Resistance Levels – $122,250 and $123,500.
Why this matters
This bitcoin story adds another data point to the current market tape and is useful when read alongside nearby source coverage.
Original source
Read on NewsBTCRelated market context

XRP Price Prediction: XRP Faces Critical Resistance Near $1.17 Despite Ripple Securing Landmark EU License
While the company secured a full MiCA license that expands its operations across the European Economic Area, market indicators sug...

Ethereum Price Stabilizes as Tether Burns $2.5 Billion USDT Stablecoins
Ethereum is slipping by more than 2% as massive $2.5 billion USDT burn on Ethereum dragged its price prediction down. Although ETH...

Sam Altman ChatGPT AI Predicts Insane Bitcoin Price by 2026
Sam Altman ChatGPT AI just circled November on the calendar and put a number next to Bitcoin Price Prediction. The model predicts...

Elon Musk Grok AI Predicts Incredible XRP Price Target by End of 2026
Elon Musk Grok AI just published what might be the most partnership-heavy XRP price prediction in this entire series. The model pr...

Hedge Funds Are Most Bearish onYen Since 2007: Could Japan Rotation Send XRP to $2.00?
XRP News: XRP is trading around $1.07, down roughly 3% over the past 24 hours, but still carrying a 6–7% weekly gain that keeps th...

XRP Reclaims A Key Support Zone As Traders Watch Open Interest Build
XRP has moved back into a zone traders are watching closely, with the $0.50 area acting as the line that decides whether the lates...