Bitcoin Price Targets $46,000 As DXY Receives Kiss Of Death
In a striking dual analysis, the financial charts paint contrasting futures for the US Dollar Index (DXY) and Bitcoin (BTC). Gert van Lagen, a technical analyst, has provided a bearish prognosis for the DXY, while simult...
Archive context
Older archive item. Useful for background and entity history, but not a fresh market-moving signal.

In a striking dual analysis, the financial charts paint contrasting futures for the US Dollar Index (DXY) and Bitcoin (BTC). Gert van Lagen, a technical analyst, has provided a bearish prognosis for the DXY, while simultaneously highlighting a bullish setup for Bitcoin that could see it aiming for a $46,000 target.
DXY Receives Kiss Of DeathThe DXY has been in an upward trend since July, as shown by the blue ascending trend line on the daily chart. However, this line was broken to the downside on October 9, indicating a change in market sentiment. Van Lagen explains, “Blue uptrend since July has been broken too. Time to continue down.”
This sentiment is reinforced by the price action within the black channel from the beginning of October till recently, where a period of consolidation is visible, succeeded by a strong downward move. The DXY dropped by 1.2% last Friday, November 3, to 104.92 and is currently undergoing a retest of the channel, a common technical pattern where the price moves back to the breakdown point before continuing in the direction of the initial direction.
A third bearish argument for the DXY is the rejection at the highlighted red zone on the chart which signifies a high timeframe Fibonacci resistance area. The Fibonacci retracement is a popular tool among traders to identify potential reversal levels. The DXY’s price action shows a “clear rejection” at this level, where the index attempted to rise but was pushed back down, reinforcing the bearish stance.
Bitcoin Price Targets $46,000Amidst the weakness of the DXY, the inverse correlation with Bitcoin becomes a focal point for crypto investors. Gert van Lagen provides insight into Bitcoin’s potential trajectory, observing a bullish pattern emerging on its 6-hour chart.
“BTC [6h] – Bullish pennant in play targeting $46k. The pennant is part of the shown ascending channel,” remarked van Lagen. The chart displays Bitcoin’s price consolidating in a pennant structure, a continuation pattern that signals a pause in a strong upward or downward trend before the next move.
The pennant is delineated by converging trend lines which have been formed by connecting the sequential highs and lows of price action, converging to a point indicative of an imminent breakout.
In this case, the pennant follows a significant upward trend, suggesting that the breakout is likely to continue in the bullish direction. The ascending channel, highlighted by two parallel upward-sloping lines, encompasses the entire bullish movement of Bitcoin on the chart, including the pennant formation. This channel serves as a guide for the price trend, indicating where support and resistance levels are anticipated at the moment.
Van Lagen’s analysis posits a targeted price of $46,000 upon the resolution of the pennant, a level that is determined by the height of the prior move that preceded the pennant, projected upward from the point of breakout. The dashed lines on the chart illustrate the potential path Bitcoin’s price could take following the breakout.
An important detail in van Lagen’s chart is the ‘Invalidation’ level marked below the pennant. This level at $34,103 is critical as it signifies where the bullish hypothesis would be considered incorrect, serving as a stop-loss point for traders acting on this pattern.
At press time, BTC traded at $34,625.
Why this matters
This bitcoin story adds another data point to the current market tape and is useful when read alongside nearby source coverage.
Original source
Read on NewsBTCRelated market context

Litecoin (LTC) Price Prediction: Mixed Technical Signals and Growing Hashrate Keep Traders Focused on $39 Support and $46 Breakout
Analysts are closely watching whether the Litecoin price can maintain support around $39 and break above the key $46 resistance le...

Dogecoin Eyes $0.12 As Traders Look For A Cleaner Breakout Signal
Dogecoin is back in a familiar place: close enough to a breakout level to get traders interested, but not far enough through it to...

Bitcoin (BTC) Price Prediction: $65K Remains Key Resistance as 4-Year Cycle Model Signals Make-or-Break Moment
The Bitcoin price today remains around $62,600-$62,900, according to TradingView data, reflecting a market that has stabilized fol...
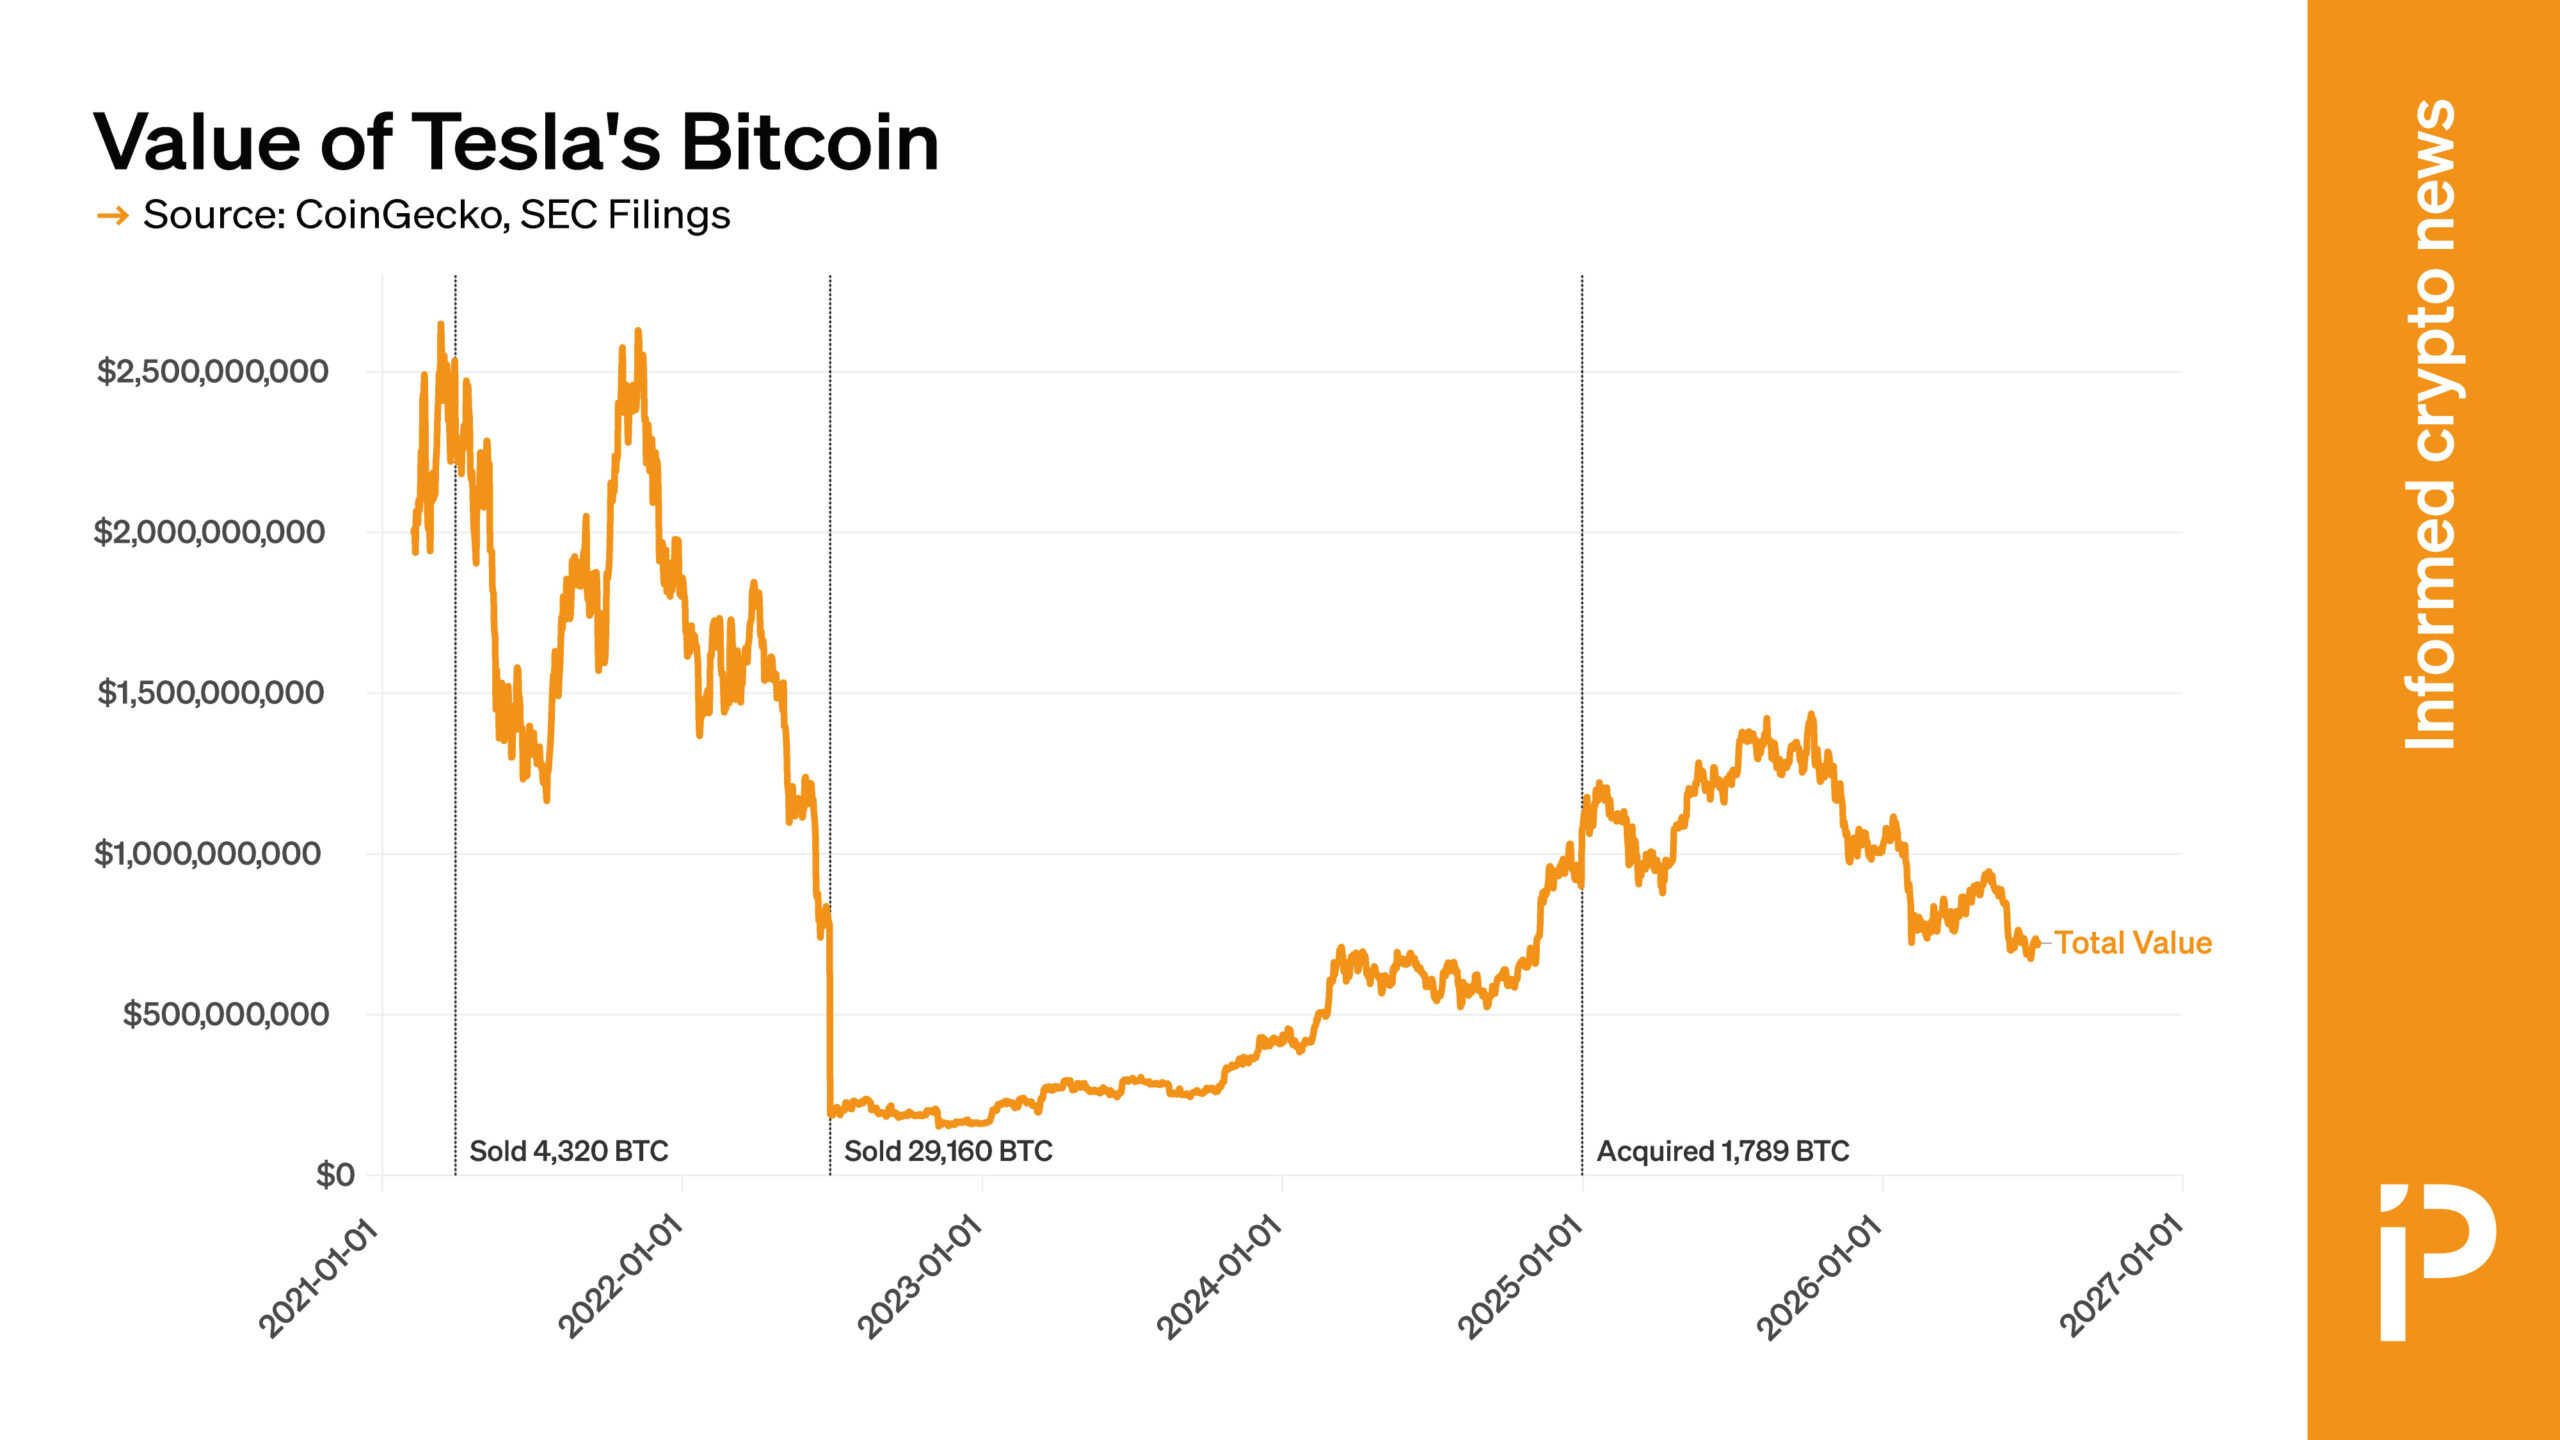
CHART: Value of Tesla’s BTC holdings have fallen by two-thirds
Tesla became one of the early firms to embrace BTC, adding it to its balance sheet in 2021; however, it all but abandoned this ini...

Why Bitcoin ATMs are becoming the last stop in America’s $11B crypto scam pipeline
Crypto scams start online with a fake bank alert, a cloned voice, a romance message, or a tech-support pop-up. Then, the last inst...

Bitcoin Price Prediction: Overlooked BTC Gold Ratio Is Flashing an Unexpected Signal
Bitcoin is hovering around $62,000, but the mood feels far less comfortable than the chart suggests. Bitcoin price prediction deba...