Bitcoin Price Tries to Climb Again – Bulls Eye Short-Term Upside
Bitcoin price is attempting to recover above the $114,200 zone. BTC is now consolidating and might attempt to clear the $115,500 resistance zone. Bitcoin started a recovery wave above the $113,500 zone. The price is trad...
Archive context
Older archive item. Useful for background and entity history, but not a fresh market-moving signal.

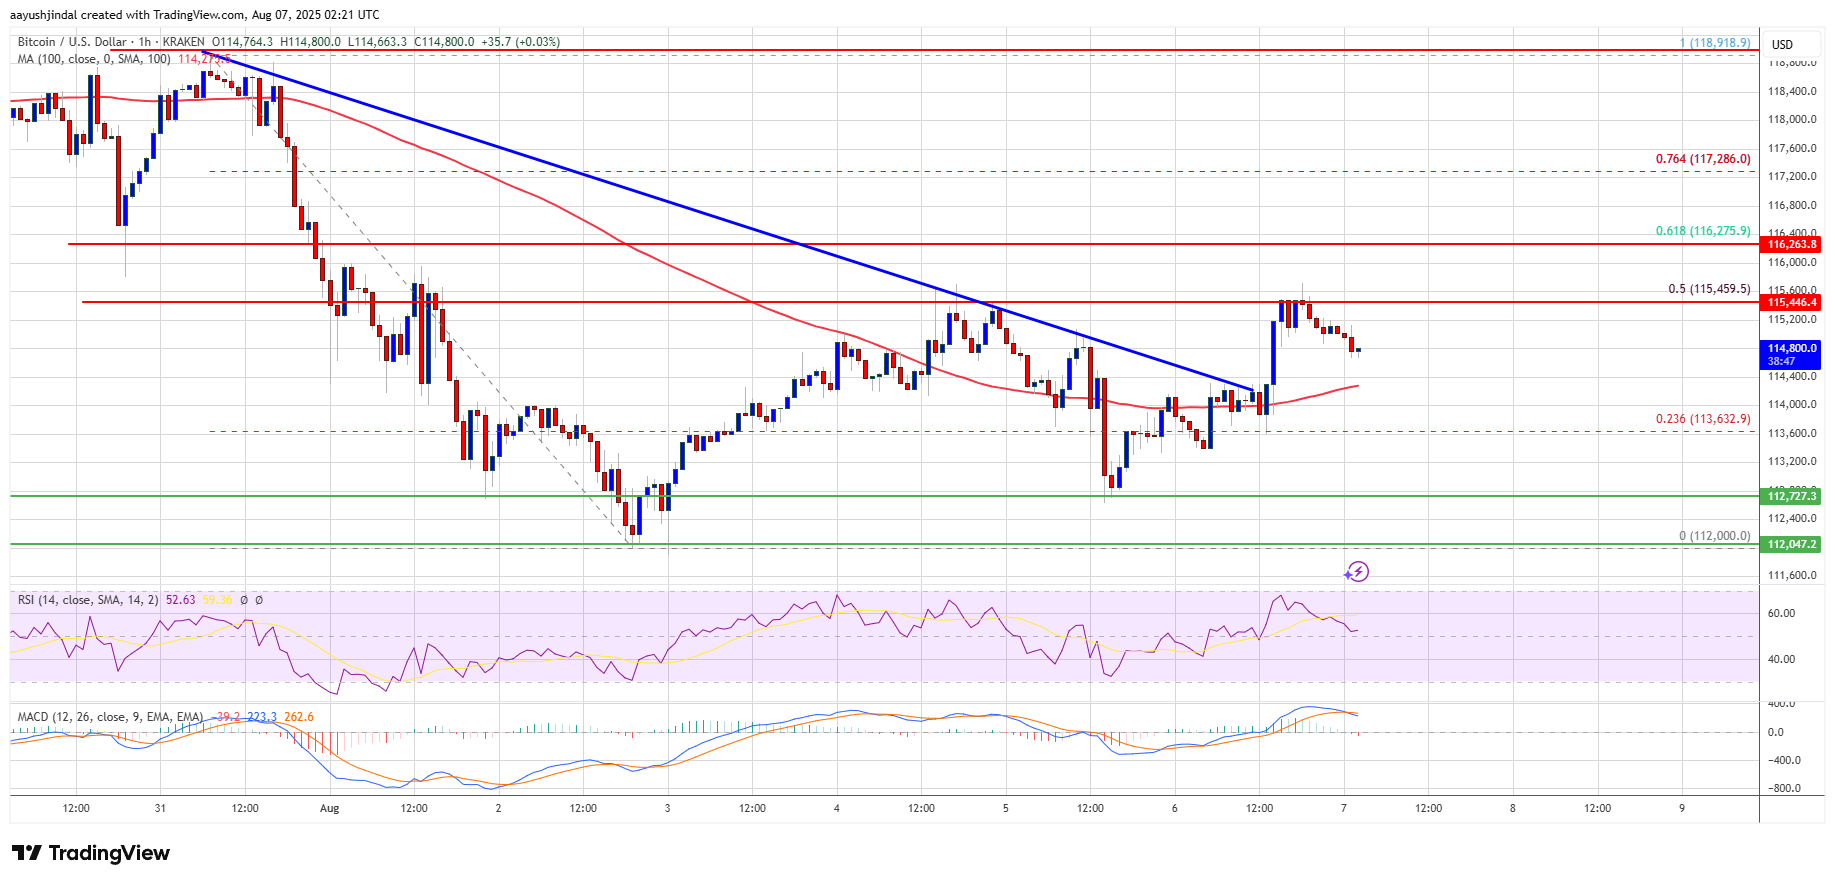
Bitcoin price is attempting to recover above the $114,200 zone. BTC is now consolidating and might attempt to clear the $115,500 resistance zone.
- Bitcoin started a recovery wave above the $113,500 zone.
- The price is trading above $114,000 and the 100 hourly Simple moving average.
- There was a break above a bearish trend line with resistance at $114,300 on the hourly chart of the BTC/USD pair (data feed from Kraken).
- The pair might start another increase if it clears the $115,500 resistance zone.
Bitcoin price found support near the $112,000 zone and started a recovery wave. BTC was able to climb above the $113,500 and $114,200 resistance levels.
Besides, there was a break above a bearish trend line with resistance at $114,300 on the hourly chart of the BTC/USD pair. The price climbed toward the 50% Fib retracement level of the move from the $118,918 swing high to the $112,000 low.
However, the bears were active near the $115,500 resistance and the price struggled to continue higher. Bitcoin is now trading above $114,000 and the 100 hourly Simple moving average.
Immediate resistance on the upside is near the $115,000 level. The first key resistance is near the $115,500 level. The next resistance could be $116,250 or the 61.8% Fib retracement level of the move from the $118,918 swing high to the $112,000 low.
A close above the $116,250 resistance might send the price further higher. In the stated case, the price could rise and test the $117,500 resistance level. Any more gains might send the price toward the $118,000 level. The main target could be $120,000.
Another Drop In BTC?If Bitcoin fails to rise above the $115,500 resistance zone, it could start another decline. Immediate support is near the $114,200 level. The first major support is near the $113,500 level.
The next support is now near the $112,000 zone. Any more losses might send the price toward the $110,500 support in the near term. The main support sits at $108,500, below which BTC might continue to move down.
Technical indicators:
Hourly MACD – The MACD is now losing pace in the bearish zone.
Hourly RSI (Relative Strength Index) – The RSI for BTC/USD is now above the 50 level.
Major Support Levels – $113,500, followed by $112,000.
Major Resistance Levels – $115,500 and $117,500.
Why this matters
This bitcoin story adds another data point to the current market tape and is useful when read alongside nearby source coverage.
Original source
Read on NewsBTCRelated market context

XRP Price Prediction: XRP Faces Critical Resistance Near $1.17 Despite Ripple Securing Landmark EU License
While the company secured a full MiCA license that expands its operations across the European Economic Area, market indicators sug...

Bitcoin (BTC) Price Prediction: BTC Holds $63K Support—Can Rising Active Addresses Offset Bearish Technical Signals?
Although the BTC price has remained near a key support zone, recent chart signals and Strategy’s sale of a portion of its Bitcoin...

Sam Altman ChatGPT AI Predicts Insane Bitcoin Price by 2026
Sam Altman ChatGPT AI just circled November on the calendar and put a number next to Bitcoin Price Prediction. The model predicts...

Bitcoin price rebounds to $63K as leverage returns creating short term volatility risk
Bitcoin's rebound has cleared the first test: price recovered. The harder one starts now: proving buyers remain after the squeeze....

Bitcoin miner bottom signal now depends on who survives weak mining profits
A Bitcoin miner-stress signal circulating on X has fallen into a zone analysts associate with severe miner pressure, putting a fam...

Elon Musk Grok AI Predicts Incredible XRP Price Target by End of 2026
Elon Musk Grok AI just published what might be the most partnership-heavy XRP price prediction in this entire series. The model pr...