Bitcoin Price Turns Attractive On Dips, 100 SMA Is The Key
Bitcoin price is correcting gains from the $64,000 resistance. BTC might find strong support near the $59,250 level or the 100 hourly SMA. Bitcoin price is correcting gains below the $62,250 resistance zone. The price is...
Archive context
Older archive item. Useful for background and entity history, but not a fresh market-moving signal.

Bitcoin price is correcting gains from the $64,000 resistance. BTC might find strong support near the $59,250 level or the 100 hourly SMA.
- Bitcoin price is correcting gains below the $62,250 resistance zone.
- The price is trading above $60,000 and the 100 hourly Simple moving average.
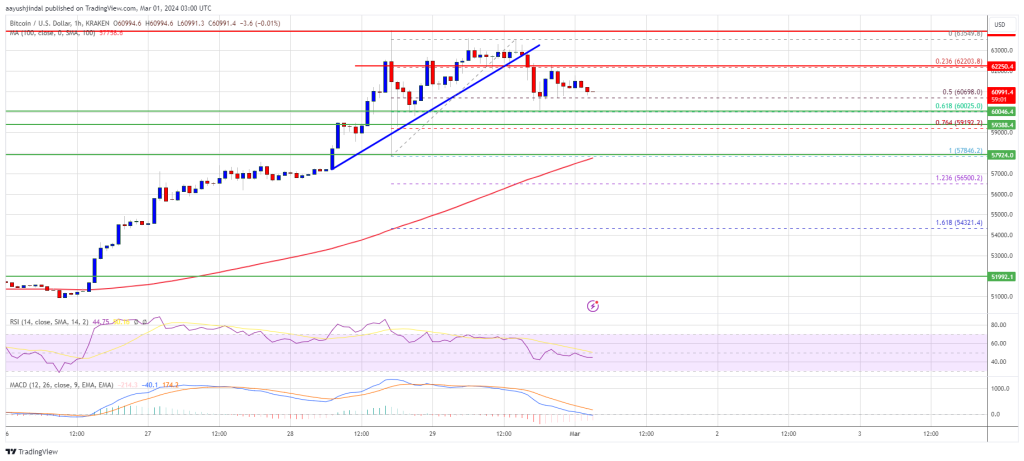
- There was a break below a connecting bullish trend line with support at $62,850 on the hourly chart of the BTC/USD pair (data feed from Kraken).
- The pair could correct lower toward $60,000 or even to the 100 hourly Simple moving average.
Bitcoin price extended its rally above the $62,000 resistance zone. BTC even cleared the $63,200 level and tested the $64,000 zone. A new multi-week high was formed near $64,000 before the price started a downside correction.
The price traded below the $62,000 support. There was a spike below the 50% Fib retracement level of the upward move from the $57,846 swing low to the $53,549 swing high.
There was a break below a connecting bullish trend line with support at $62,850 on the hourly chart of the BTC/USD pair. Bitcoin is still trading above $60,000 and the 100 hourly Simple moving average.
Source: BTCUSD on TradingView.com
Immediate resistance is near the $62,200 level. The next key resistance could be $62,850, above which the price could rise toward the $64,000 resistance zone. If the bulls remain in action, the price could even surpass $64,000 and test $65,000. Any more gains might send the price toward the $68,000 zone.
Are Dips Limited In BTC?If Bitcoin fails to rise above the $62,200 resistance zone, it could continue to move down. Immediate support on the downside is near the $60,000 level and the 61.8% Fib retracement level of the upward move from the $57,846 swing low to the $53,549 swing high.
The first major support is $58,000 or the 100 hourly SMA. If there is a close below $58,000, the price could start a decent pullback toward the $56,500 zone. Any more losses might send the price toward the $55,000 support zone.
Technical indicators:
Hourly MACD – The MACD is now losing pace in the bullish zone.
Hourly RSI (Relative Strength Index) – The RSI for BTC/USD is now below the 50 level.
Major Support Levels – $60,000, followed by $58,000.
Major Resistance Levels – $62,200, $62,850, and $64,000.
Why this matters
This bitcoin story adds another data point to the current market tape and is useful when read alongside nearby source coverage.
Original source
Read on NewsBTCRelated market context

Ethereum Price Stabilizes as Tether Burns $2.5 Billion USDT Stablecoins
Ethereum is slipping by more than 2% as massive $2.5 billion USDT burn on Ethereum dragged its price prediction down. Although ETH...

Hedge Funds Are Most Bearish onYen Since 2007: Could Japan Rotation Send XRP to $2.00?
XRP News: XRP is trading around $1.07, down roughly 3% over the past 24 hours, but still carrying a 6–7% weekly gain that keeps th...

Cardano Price Prediction: ADA Pulls Back to $0.17 After a Strong Weekly Rally as Bulls Watch $0.20 and $0.22 Reclaim
Cardano price is trading near $0.17 after a weaker 24-hour session, according to Brave New Coin data. ADA is down around 4.84% on...

Ethereum’s treasury boom now has one company nearing 5% of supply
Ethereum treasury company BitMine said it now holds 5,742,237 ETH, or 4.8% of Ethereum's (ETH) 120.7 million token supply, putting...

Crypto News, July 8: U.S. Strikes Iran Again, Ethereum Price Wobbles After Bitcoin Spot Sell-Off
Crypto markets woke up to fresh news as U.S. strikes hit Iran again. The Bitcoin price is stuck chopping between $62,000 and $64,5...

Bitcoin Slips to $62,000, Paring Rebound as CryptoQuant Sees Room Higher
Bitcoin Magazine Bitcoin Slips to $62,000, Paring Rebound as CryptoQuant Sees Room Higher Bitcoin traded near $62,000 today, surre...