Bitcoin Sellers Exhausted, Accumulators HODL The Line
Bitcoin supply-side dynamics and on-chain indicators look to be as strong as ever, but macroeconomic headwinds remain for legacy and risk assets.The below is an excerpt from a recent edition of Bitcoin Magazine PRO, Bitc...
Archive context
Older archive item. Useful for background and entity history, but not a fresh market-moving signal.
Bitcoin supply-side dynamics and on-chain indicators look to be as strong as ever, but macroeconomic headwinds remain for legacy and risk assets.
The below is an excerpt from a recent edition of Bitcoin Magazine PRO, Bitcoin Magazine's premium markets newsletter. To be among the first to receive these insights and other on-chain bitcoin market analysis straight to your inbox, subscribe now.
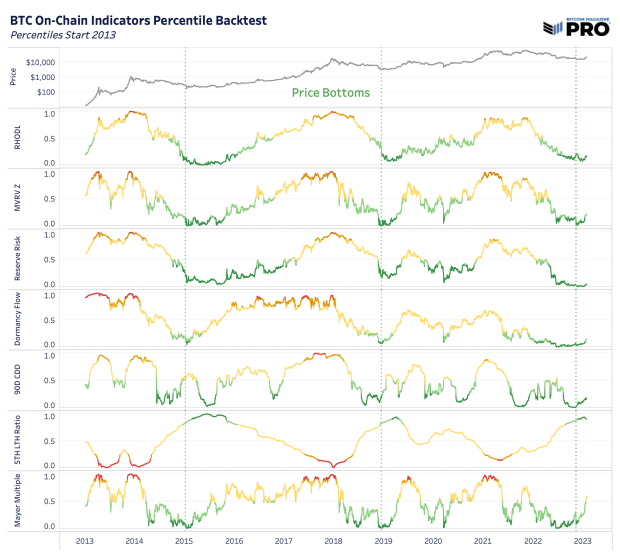
Analyzing On-Chain Bottom IndicatorsIn this week’s dashboard release, we highlighted some key on-chain metrics we like to track. In this article, we want to walk through more of those in detail. Across bitcoin’s short history, many on-chain cyclical indicators are currently pointing to what looks to be a classic bottom in bitcoin price. Market extremes — potential tops and bottoms — are where these indicators have proven to be the most useful.
On-chain indicators overlaid with previous bitcoin price bottoms.However, these indicators need to be considered alongside many other macroeconomic factors and readers should consider the possibility that this could be another bear market rally — as we still sit below the 200-week moving average price of around $24,600. That being said, if price can sustain above $20,000 in the short-term, the bullish metrics paint a compelling sign for more long-term accumulation here.
A major tail risk is a possible market-wide selloff in risk assets that are currently pricing a “soft landing” style scenario along with the potentially incorrect expectations of a Federal Reserve policy pivot in the second half of this year. Many economic indicators and data still point to the likelihood that we’re in the midst of a bear market similar to 2000-2002 or 2007-2008 and the worst has yet to unfold. This secular bear market is what’s different about this bitcoin cycle compared to any other in the past and what makes it that much harder to use historical bitcoin cycles after 2012 as perfect analogues for today.
All that being said, from a bitcoin-native perspective, the story is clear: Capitulation has clearly unfolded, and HODLers held the line.
Given the transparent nature of bitcoin ownership, we can view various cohorts of bitcoin holders with extreme clarity. In this case, we are viewing the realized price for the average bitcoin holder as well as the same metric for both long-term holders (LTH) and short-term holders (STH).
The realized price, STH realized price and LTH realized price can give us an understanding of where various cohorts of the market are in profit or underwater.
A look at realized price for short- and long-term holders.On a monthly basis, realized losses have flipped to realized profits for the first time since last April.
Capitulation and loss taking has flipped to profit realization across the network, which is a very healthy sign of thorough capitulation.
There is a strong case to be made that given the current elasticity of bitcoin’s supply — as evidenced by the historically small number of short-term holders or rather the large number of long-term holders — it will be challenging to shake out current market participants. Especially considering the gauntlet endured over the previous 12 months.
Statistically, long-term bitcoin holders are usually unfazed in the face of bitcoin price volatility. The data shows a healthy amount of accumulation throughout 2022, despite a massive risk-off event in both the bitcoin and legacy market.
While liquidity dynamics in legacy markets should be noted, the supply-side dynamics for bitcoin look to be as strong as ever. All it will take for a significant price appreciation will be a small influx of newfound demand.
Like this content? Subscribe now to receive PRO articles directly in your inbox.
Relevant Past Articles:- BM Pro Market Dashboard Release!
- On-Chain Data Shows 'Potential Bottom' For Bitcoin But Macro Headwinds Remain
- The Everything Bubble: Markets At A Crossroads
- Not Your Average Recession: Unwinding The Largest Financial Bubble In History
- Key Bitcoin And Equity Dynamics To Watch Right Now
- Take A Hike: Fed Lags Miles Behind The Curve On FOMC Eve
Why this matters
This bitcoin story adds another data point to the current market tape and is useful when read alongside nearby source coverage.
Original source
Read on Bitcoin MagazineRelated market context

How Far Should Crypto Firms Trace a Transaction? FCA Says Risk Should Decide
Brokers and trading platforms handling cryptoassets should be able to explain why their monitoring systems flag a transaction and...

Ethereum’s long-awaited Glamsterdam upgrade hits another roadblock as 13 security risks emerge
Ethereum developers have postponed the Glamsterdam upgrade on a major test network after identifying potential security risks affe...
Dune Adds Real-Time Spot And Perpetual Trade Feeds Across On-Chain Markets
TL;DR: Dune has launched normalized real-time feeds for spot and perpetual DEX trades, designed to help institutional desks compar...

HTX Research Publishes Crypto Market Outlook Ahead of the 2026 U.S. Midterm Elections
HTX Research, the dedicated research arm of HTX, has published a new report titled Crypto Market Outlook Before and After the 2026...

Ethereum Glamsterdam Upgrade Delayed Over Smart Contract Security Risks
Ethereum developers have postponed the Glamsterdam upgrade on the Hoodi testnet after researchers identified potential security ri...
SEC Flags AI 'Super Intelligence' and Tokenization as Systemic Market Risks
The regulator's Division of Examinations named "super intelligence and other advanced technologies" as a focus area alongside toke...