How the Updated MVRV Z-Score Improves Bitcoin Price Predictions
The Bitcoin MVRV Z-Score has historically been one of the most effective tools for identifying market cycle tops and bottoms in Bitcoin. Today, we're excited to share an enhancement to this metric that makes it even more...
Archive context
Older archive item. Useful for background and entity history, but not a fresh market-moving signal.
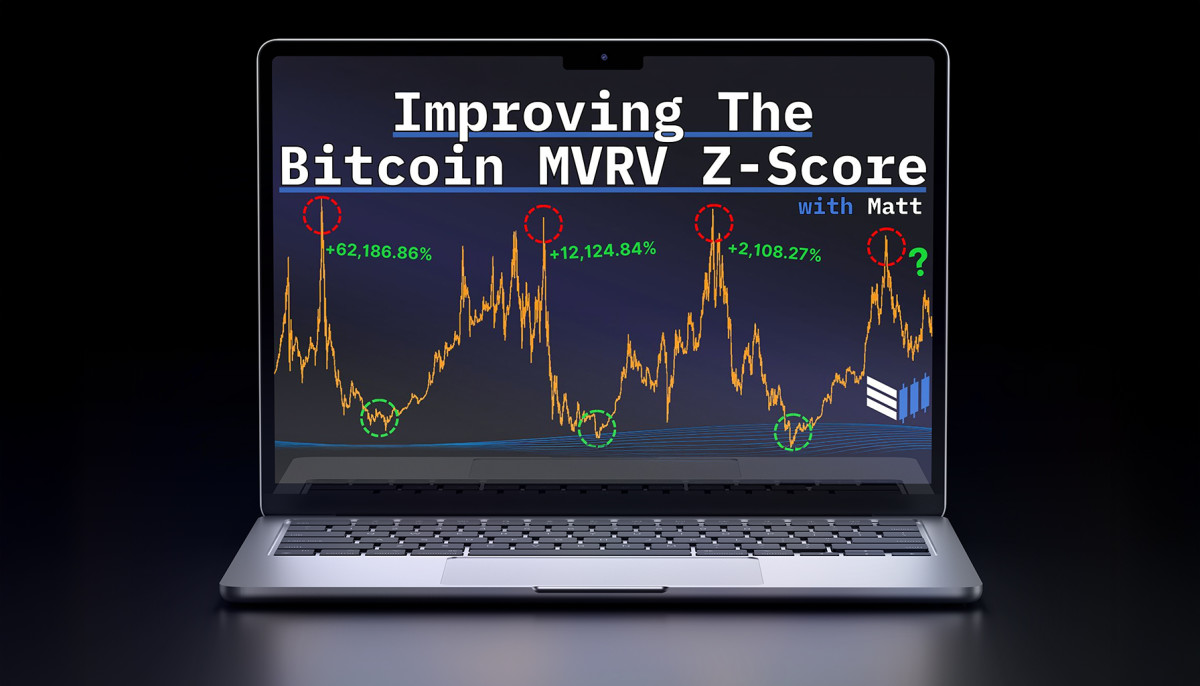
The Bitcoin MVRV Z-Score has historically been one of the most effective tools for identifying market cycle tops and bottoms in Bitcoin. Today, we're excited to share an enhancement to this metric that makes it even more insightful for today's dynamic market conditions.
What Is the Bitcoin MVRV Z-Score?The MVRV Z-Score is derived by analyzing the ratio between Bitcoin’s realized cap (the average acquisition cost of all Bitcoin in circulation) and its market cap (current network valuation). By standardizing this ratio using Bitcoin's price volatility (measured as the standard deviation), the Z-Score highlights periods of overvaluation or undervaluation relative to historical norms.
Figure 1: MVRV Z-Score effectiveness may be reduced due to diminishing volatility.Peaks in the red zone signal overvaluation, suggesting optimal profit-taking opportunities. Bottoms in the green zone indicate undervaluation, often marking strong accumulation opportunities. Historically, this metric has been remarkably accurate in pinpointing major market cycle extremes.
While powerful, the traditional MVRV Z-Score has its limitations. In past cycles, the Z-Score reached values of 9–10 during market tops. However, in the last cycle, the score only reached around 7. This may be due to the rounded double-peak cycle instead of the sharp blow-off top we usually experience. Regardless, there’s the necessity to factor in the evolving market dynamics, with increasing institutional involvement and changing investor behavior.
The Enhanced MVRV Z-ScoreThe MVRV Z-Score standardizes the raw MVRV data using Bitcoin’s entire price history, which includes the extreme volatility of its early years. As Bitcoin matures, these early data points may distort its relevance to current market conditions. To address these challenges, we’ve developed the MVRV Z-Score 2YR Rolling. Instead of using Bitcoin's entire price history, this version calculates volatility based only on the previous two years of data.
Figure 2: MVRV Z-Score 2YR Rolling accounts for reduced market volatility.This approach better accounts for Bitcoin’s growing market cap and shifting dynamics and ensures the metric adapts to more recent trends, offering greater accuracy for contemporary market analysis. It still excels at identifying market cycle tops and bottoms but adapts to modern conditions. In the last cycle, this version captured a higher peak value than the traditional Z-Score, aligning more closely with 2017's price action. On the downside, it continues to identify strong accumulation zones with high precision.
Raw MVRV RatioAnother complementary approach involves analyzing the MVRV ratio without standardizing for volatility. By doing so, we can see the previous cycle’s MVRV ratio peaked at 3.96, compared to 4.72 in the cycle before that. These values suggest less deviation, potentially offering a more stable framework for projecting future price targets.
Figure 3: MVRV data can help to forecast potential price targets.Assuming a realized price of $60,000 (factoring in the current projected increase over the next six months) and an MVRV ratio of 3.96, a potential peak price could be close to $240,000. If diminishing returns reduce the ratio to 3.0, the peak price might still reach $180,000.
ConclusionWhile the MVRV Z-Score is still one of the most effective tools for timing market cycle peaks and bottoms, we need to be prepared for this metric potentially not reaching similar highs as prior cycles. By adapting this data to better factor in the changing market dynamics of Bitcoin, we can account for reduced volatility as BTC grows.
For a more in-depth look into this topic, check out a recent YouTube video here:
Improving The Bitcoin MVRV Z-Score
For more detailed Bitcoin analysis and to access advanced features like live charts, personalized indicator alerts, and in-depth industry reports, check out Bitcoin Magazine Pro.
Disclaimer: This article is for informational purposes only and should not be considered financial advice. Always do your own research before making any investment decisions.
Why this matters
This bitcoin story adds another data point to the current market tape and is useful when read alongside nearby source coverage.
Original source
Read on Bitcoin MagazineRelated market context
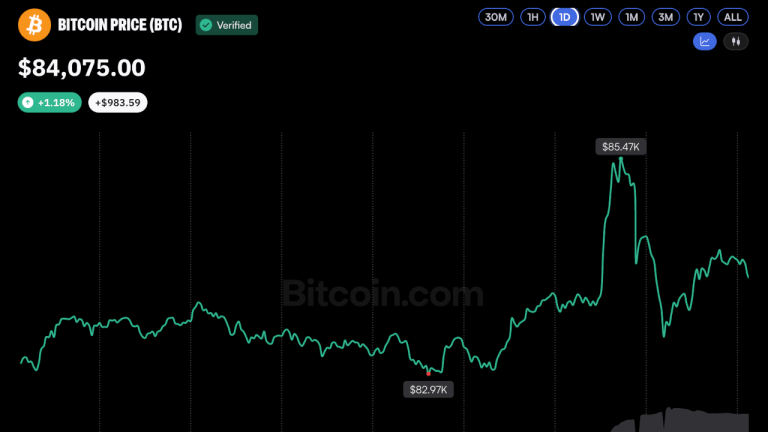
Bitcoin Price Gives Up Gains After Short-Lived Pump to $85.5K
Bitcoin pumped above $85,500 on Wednesday morning following the release of lower-than-expected U.S. PCE inflation data for August—...

Open USD Stablecoin Goes Live as Stripe, Visa and Mastercard Open It to Businesses
Open USD (OUSD), the dollar stablecoin backed by Coinbase, Mastercard, Shopify, Stripe and Visa, went live on Wednesday, its opera...

Short-term Bitcoin buyers see 13% profit as market mirrors past cycles
Short-term Bitcoin gains highlight market volatility, with potential for rapid shifts in investor sentiment and increased risk of...

Standard Chartered says Ethena’s ENA could crush Bitcoin and Ethereum returns by 2028
Standard Chartered expects Ethena’s ENA token to rise about sevenfold by 2028, provided the protocol can rebuild its shrinking syn...

Bitcoin gains as rate hike expectations ease after soft PCE data
Bitcoin's sensitivity to macroeconomic data highlights its evolving role in financial markets, with institutional demand showing s...

Superstate Expands Tokenized Short-Duration US Treasury Fund (USTB) To Base
In a major development confirmed on SEPTEMBER 30, 2026, Confirmed announcement/filing for Superstate Expands Tokenized Short-Durat...