Is This The Spark? New Bitcoin Metric Points To Bullish Shift
Bitcoin dipped marginally after reaching a new peak above $97,000 on May 2. It retreated to just below $94,000, a 3% to 4% decline from its recent high. Although short-term price movements are keeping traders nervous, lo...
Archive context
Older archive item. Useful for background and entity history, but not a fresh market-moving signal.

Bitcoin dipped marginally after reaching a new peak above $97,000 on May 2. It retreated to just below $94,000, a 3% to 4% decline from its recent high. Although short-term price movements are keeping traders nervous, longer-term on-chain data is beginning to exhibit signs that may influence what happens next.
Index Reading Indicates A Potential Early Bull MarketOne gauge, which is referred to as the Bitcoin Composite Index v2.0, is now standing at a reading of 0.8. The index mixes price action with blockchain activity and attempts to weigh where Bitcoin could be going. For analyst Constantin Kogan, a reading on this scale has previously appeared ahead of some massive price rallies, such as in 2017 and 2021.
Kogan described how if this number rises to 1.0 and holds, Bitcoin may begin to accelerate significantly faster. The index isn’t quite there now—but it’s heading in the right direction. One of the most important components of the index, the “Running ATH Price,” has begun trending upward too. This suggests that additional buyers are entering the market and faith may be on the rise.
The upward momentum in Bitcoin is just starting to build, with on-chain metrics like the Bitcoin Composite Index signaling the beginning of a bull market. The index has already reached 0.8 (80%). Here are three possible scenarios:
Bullish: BTC could surge to… pic.twitter.com/8bZ4vmr2CH
— Constantin Kogan (@constkogan) May 4, 2025
Price Target May Hit $175K If Momentum ContinuesIf Bitcoin maintains its momentum and drives the Composite Index to more than 1.0, analysts predict the price to rise sharply. The target range given is between $150,000 and $175,000. That’s if bullish momentum accelerates and past trends are repeated.
But if the index remains wedged between 0.8 and 1.0, Bitcoin may stall for a bit. That means a range-bound market, ranging from $90,000 to $110,000. Kogan also highlighted a third, less probable route—if the index falls below 0.75. Then Bitcoin may correct back to $70,000 to $85,000.
Supply Data Shows Where Buyers Stepped InThe second part of the puzzle is from the UTXO Realized Price Distribution chart, also referred to as the URPD chart. Provided by analyst Checkmate, it plots where the holders of Bitcoin last transferred their coins. This provides a sense of who purchased when—and at what price.
A huge segment of buyers appears to have entered between $93,000 and $98,000. That region is currently behaving as a crucial supply zone. It’s the region where investors have just bought Bitcoin and may hold on or sell based on what follows.
Market Awaits Clear Move From Current ZoneBitcoin is squarely in the middle of that range at about $94,000. As Checkmate points out, the next move will depend on whether price breaks out strongly or gets rejected. A strong breakout, evidenced by a powerful daily candle, could turn recent supply into profit and propel prices higher. But if the price can’t rise through this area, it could create a lower high and attract additional selling pressure.
For the moment, Bitcoin sits in wait mode. Traders and analysts are monitoring both the Composite Index and supply figures to determine whether the current lull becomes the next leg up—or a further step down.
Featured image from Gemini Imagen, chart from TradingView
Why this matters
This bitcoin story adds another data point to the current market tape and is useful when read alongside nearby source coverage.
Original source
Read on NewsBTCRelated market context

Mitchell Askew Explains What 15M Inactive BTC Means for Bitcoin’s Next Move
Bitcoin Magazine Mitchell Askew Explains What 15M Inactive BTC Means for Bitcoin’s Next Move Bitcoin is rallying despite a Fed rat...

Ripple CEO Brad Garlinghouse Says XRP and Solana Can Both Thrive in Crypto’s Next 5 Years
Garlinghouse’s comments have resurfaced as XRP and Solana both trade near important technical levels following recent gains. “I’m...

Bitcoin (BTC) Price Today: BTC Holds Uptrend as $84K FVG Shapes Intraday Setup
The setup comes as on-chain data shows that profit-taking remains relatively contained despite the latest Bitcoin price recovery....
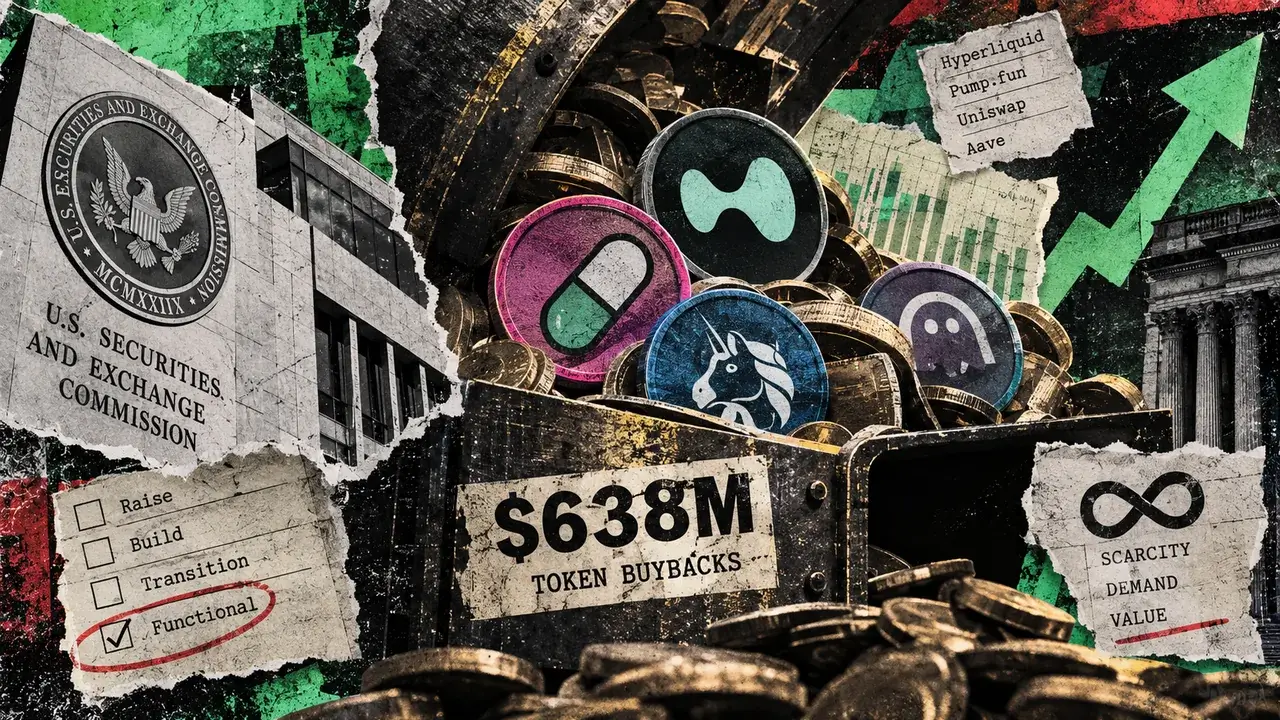
SEC clears regulatory hurdle as crypto token buybacks hit record $638 million
Crypto projects spent about $638 million with token buybacks through late August 2026, according to Allium Labs data. That is alre...

Bitcoin Price Never Closed Below Expectation in 2026 Bear Market
Bitcoin never posted a daily close below its realized price during the current bear market, and the June 2026 low held above that...

Fed proposed stablecoin rule could trigger a 48-hour liquidation run
The Federal Reserve's proposed rules for the payment stablecoin issuers it supervises include a crisis clock measured in hours. An...