Shiba Inu Faces Make-Or-Break Level That Could Define Q4 2025
Shiba Inu is approaching a decisive inflection on the 6-day SHIB/USDT chart, according to analyst CryptoNuclear’s October 1 TradingView update. The pair is pressing into a long-standing demand shelf between $0.00000850 a...
Archive context
Older archive item. Useful for background and entity history, but not a fresh market-moving signal.

Shiba Inu is approaching a decisive inflection on the 6-day SHIB/USDT chart, according to analyst CryptoNuclear’s October 1 TradingView update. The pair is pressing into a long-standing demand shelf between $0.00000850 and $0.00001183, a band that has repeatedly arrested declines since 2022 and underpinned the market’s extended sideways structure. The zone is highlighted as the market’s “make-or-break” area: hold here and the path opens to a multi-leg advance; lose it and the structure degrades into a deeper drawdown.
Key Shiba Inu (SHIB) Price LevelsStructurally, the macro picture remains defined by lower highs from the all-time peak, which continues to signal longer-term seller control. That said, the persistence of bids inside the $0.00000850–$0.00001183 box speaks to ongoing accumulation. The 6-day candles have compressed into a progressively tighter range, a classic volatility contraction that typically precedes expansion. With range width narrowing and tests of the same support recurring, the next directional move is likely to be sharp.
On the topside, the first pivot is $0.00001580. CryptoNuclear frames this level as the initial breakout trigger on a 6-day closing basis, with volume confirmation required to validate impulsive intent. A decisive close above would expose a stair-step series of upside references at $0.00001940, $0.00002400, and $0.00003338, each corresponding to prior supply within last year’s distribution.
Beyond those intermediate shelves sits a larger supply cluster at $0.00007870–$0.00008836, marked on the chart as the “High” band; in the event of a macro reversal, that zone could act as a longer-horizon magnet where profit-taking would be expected.
Failure to defend the accumulation base flips the script. A breakdown through $0.00000850, especially on expanding volume, would invalidate the range thesis and shift focus to $0.00000543, annotated as the “Low” on CryptoNuclear’s chart and the next meaningful liquidity pocket below. Acceptance beneath that threshold would increase the risk of capitulation dynamics and the formation of new cycle lows, given the lack of dense historical trading in between.
Market positioning follows naturally from the map. Optimistic dip-buyers view the $0.00000850–$0.00001183 area as value and a favorable risk-to-reward location, provided the market can reclaim and hold above $0.00001580 to convert resistance into support and sustain a trend continuation sequence.
Cautious participants see symmetrical risk: the same compression that fuels breakouts can fuel breakdowns, and a daily-to-weekly close beneath the floor would argue for defense first. Neutral traders remain patient, waiting for confirmation via a 6-day close beyond either $0.00001580 or $0.00000850 before committing size.
In sum, SHIB is coiled at a historically significant base that is likely to determine the asset’s macro path into 2025–2026. Respecting support keeps the recovery track intact toward $0.00001940, $0.00002400, and $0.00003338, with a more ambitious runway into the $0.00007870–$0.00008836 supply envelope if momentum broadens.
Losing the base hands control back to sellers with $0.00000543 as the first downside checkpoint. For investors and swing traders alike, the $0.00000850–$0.00001183 zone—and the reaction around $0.00001580 overhead—are the levels to watch.
At press time, SHIB traded at $0.00001231.
Why this matters
This cryptocurrency story adds another data point to the current market tape and is useful when read alongside nearby source coverage.
Original source
Read on NewsBTCRelated market context

Bitcoin (BTC) Price Today: Whale Selling and ETF Outflows Put $76K Support to the Test
The Bitcoin price remains within a broader range, however, with technical support between $76,000 and $77,500 continuing to attrac...

Ethereum Price Prediction: Supply Shock Could Send ETH Above $3,000
Ethereum trades at just above $2,500, but the flat 24-hour print masks a more interesting story underneath that could flip its pri...

Ethereum (ETH) Price Prediction: $74M Liquidation Flush Puts the $2,450 Support Zone in the Spotlight
Ethereum is trading near $2,483 after falling roughly 1.47% over the past 24 hours, according to Brave New Coin data. ETH briefly...

XRP Price Prediction: One Vote Could Unlock XRP Ledger’s Next Big Upgrade
XRP is trading at $1.40, outperforming the crypto market and bearish price prediction, as the network’s next major upgrade is sitt...
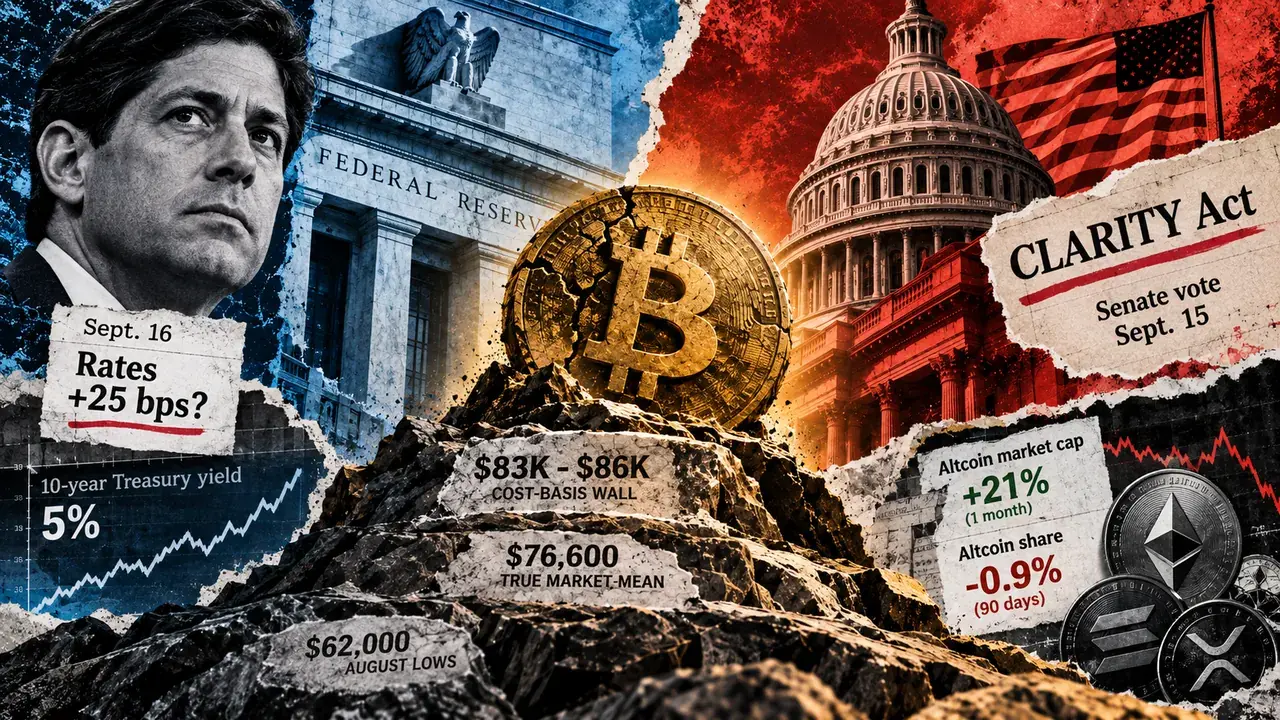
Altcoins gained 21% and still lost ground to Bitcoin. What would finally turn the tables?
Glassnode reported that altcoin market capitalization climbed 21% over the past month, while altcoins' share of the combined Bitco...

Ethereum Price Prediction: Today’s Clarity Act Could Send ETH Above $3,000
Ethereum price trades at $2,470 today, down 1.8% on the day, as the Clarity Act prediction odds fall to under 20% this week. That...