Ethereum chart pattern supports ‘moon shot’ rally to new price highs if confirmed — Trader
Key Takeaways:Veteran trader Peter Brandt suggests a potential Ethereum rally to $3,800–$4,800 if ETH breaks above a rising wedge pattern.A short-term pullback may occur as the taker buy-sell ratio drops below one, signa...
Archive context
Older archive item. Useful for background and entity history, but not a fresh market-moving signal.

Key Takeaways:
Veteran trader Peter Brandt suggests a potential Ethereum rally to $3,800–$4,800 if ETH breaks above a rising wedge pattern.
A short-term pullback may occur as the taker buy-sell ratio drops below one, signaling caution from futures traders.
Ethereum’s native token Ether (ETH) opened its weekly candle at $1,807 on May 7, and now it is close to recording its highest 7-day returns of 38% since December 2020.
Ether also surpassed its realized price for accumulating addresses ($1,900), which is the average cost basis for holders, signaling profits for users. As illustrated in the chart, most of the buying pressure for ETH came from Binance, which is currently the most active exchange for ETH traders.
Ethereum realized price. Source: CryptoQuantElevated activity at Binance and an uptick in outflows reflect strong trader confidence, liquidity, and sustained bullish momentum in the current market.
“Moonshot” rally to new highs for EthereumIn a recent X post, veteran trader Peter Brandt highlighted a developing market structure that could pave the way for an Ethereum rally, provided the altcoin breaks through a key "congestion" pattern. Brandt identified a rising wedge formation on the chart—a pattern often considered bearish.
Ethereum analysis by Peter Brandt. Source: X.comHowever, he suggested that a breakout above this pattern could propel Ethereum’s price toward the descending resistance line, targeting a range between $3,800 and $4,800.
This analysis marks a notable shift in Brandt’s outlook from 2024, aligning with the renewed optimism for the altcoin.
Ethereum futures saw a 42% surge in open interest (OI), climbing from $21.3 billion to $30.4 billion between May 8 and May 11, 2025. Nearing its all-time high of $32 billion, this spike reflects heightened market activity and growing trader engagement. The rapid increase in OI signals strong interest in Ether futures, potentially paving the way for increased price volatility.
Ethereum futures open interest. Source: CoinGlassRelated: Altseason is coming, 40% daily gains to become ‘new normal’ — Analyst
Ethereum’s higher-time frame (HTF) chart reflects a price rise on the weekly chart, where the altcoin has jumped toward the 50 and 100-week exponential moving averages (EMAs) over the past couple of weeks. Historically, such a recovery marks a price bottom but could also signal the beginning of a small correction period after the EMAs retest.
Ethereum weekly chart analysis. Source: Cointelegraph/TradingViewUsing Fibonacci retracement levels, ETH has retested the 0.5 to 0.618 range (orange box), which aligns with a price level of $2,500. This retest represents the first leg of the recovery, but a short-term pullback may occur before further bullish action unfolds.
With ETH prices moving at a parabolic rate over the past few days, liquidation heatmaps noted higher buy-side liquidity between $2,200 and $2,400, after a short-squeeze took prices up to $2,608.
Ethereum taker buy-sell ratio. Source: CryptoQuantSimilarly, the taker buy-sell ratio is beginning to slow down and dropped below 1 on May 10. The ratio of buy volume divided by sell volume of takers in perpetual swap trades indicates futures sentiment, and a ratio below 1 implies short-term bearishness.
Thus, traders could approach the coming days more cautiously, with ETH consolidating under the $2,500 level.
Related: Ethereum price greenlit for further upside after surprise 29% ETH rally
This article does not contain investment advice or recommendations. Every investment and trading move involves risk, and readers should conduct their own research when making a decision.
Why this matters
This ethereum story adds another data point to the current market tape and is useful when read alongside nearby source coverage.
Original source
Read on CointelegraphRelated market context

Ethereum Price Prediction: Another Protocol Hacked for $7.5 Million
Ethereum price prediction has turned more cautious after the Verus Ethereum bridge suffered a $7.5 million exploit, raising fresh...

Boardwalk activates BMX to BWLK token migration module on Ethereum
Boardwalk activates its BMX to BWLK migration module on Ethereum, offering a 1:1 token swap over six months with a reduced supply...
Cryptoquant Founder Warns Bitcoin Spot Demand Fades While Futures Traders Hold Steady
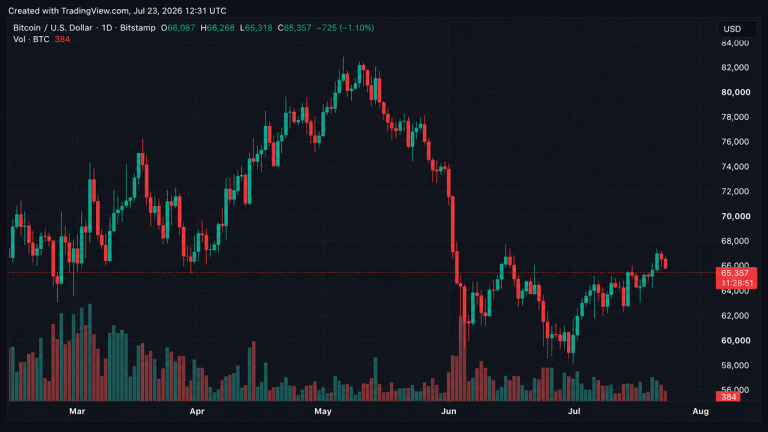
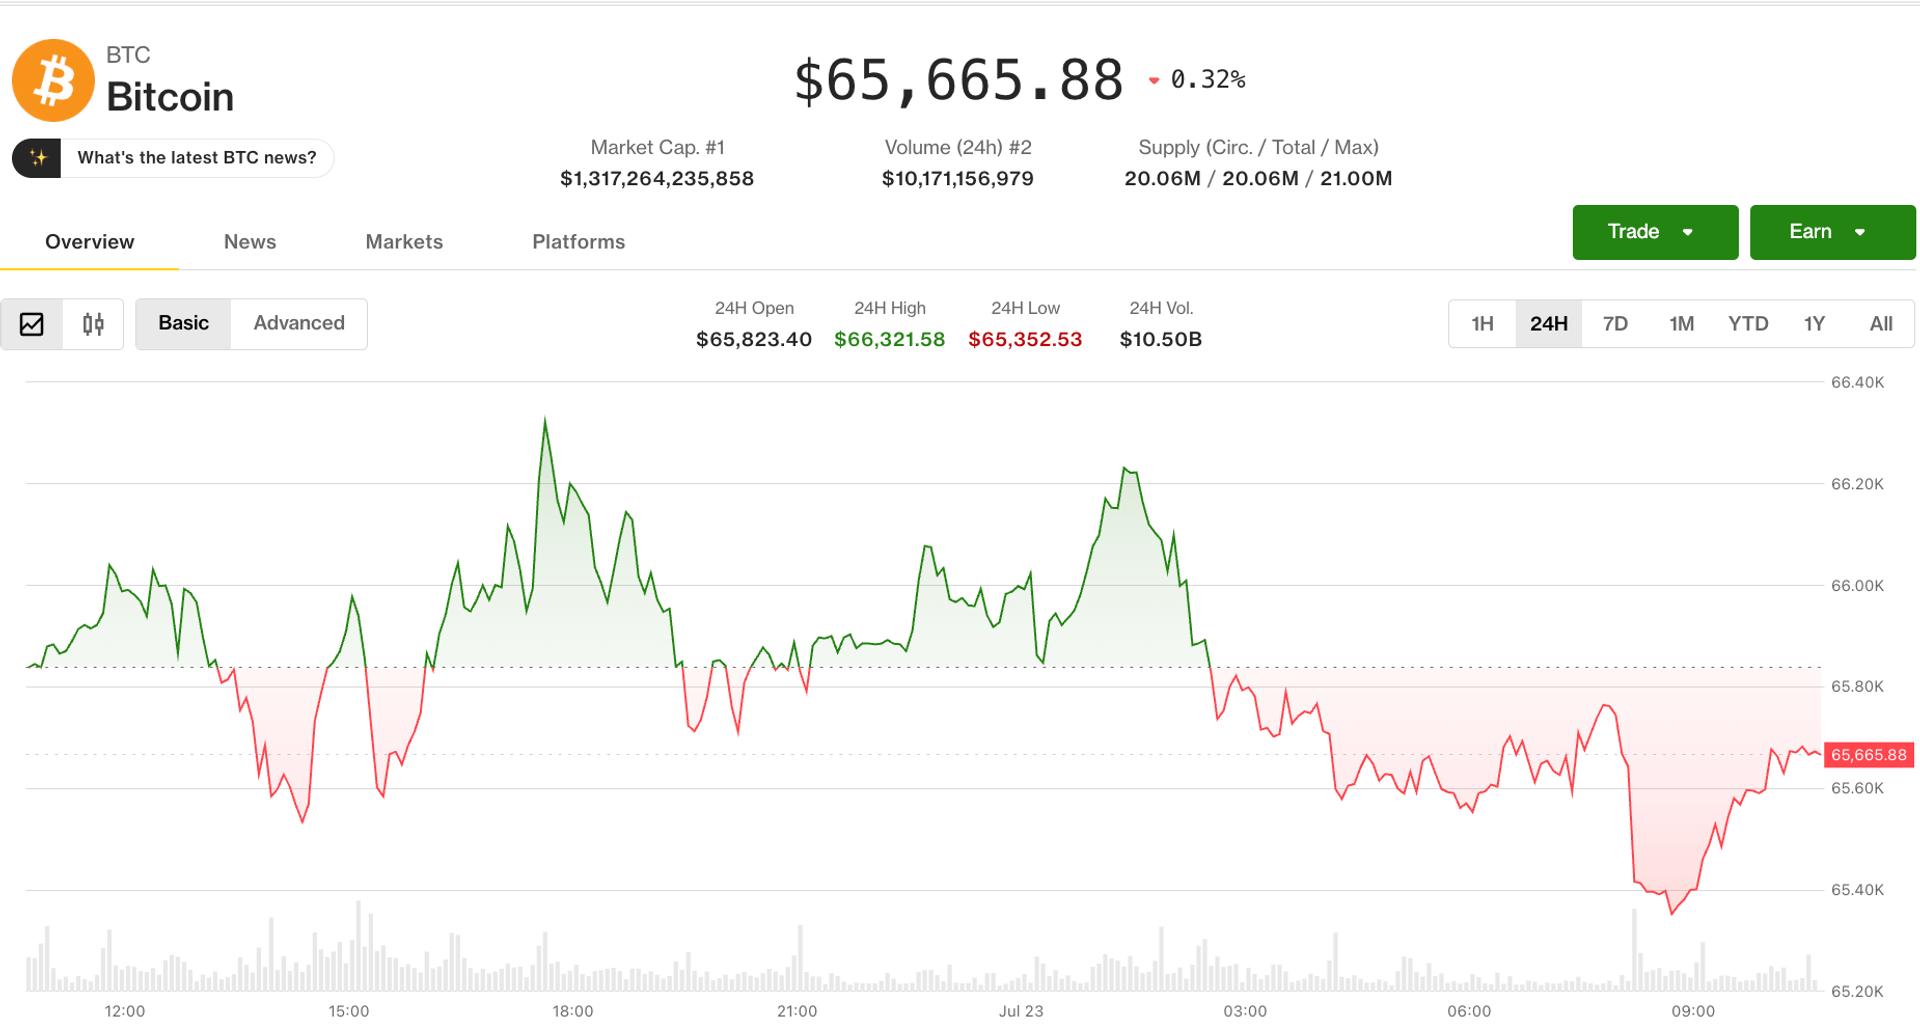
Bitcoin slipped to the mid $65,000 range over the 24 hours ending the morning of July 23, 2026, as traders paused after a strong m...

Swiss Cantonal Bank BancaStato Adds Bitcoin And Ethereum Trading With Sygnum
A Swiss cantonal bank has moved crypto trading directly into its normal banking experience, and that is the part of the story that...
Crypto catches its breath as bitcoin settles into a holding pattern amid July rally
BTC is rangebound between $64,000 and $66,800 after a 13% recovery from July's lows, with macro markets offering little direction...

XRP Price Breaks Resistance, But ETF Flows Warn Bulls
XRP price climbed from around $1.11 to $1.14 during the past week, briefly testing resistance near $1.16 before easing back despit...