Ethereum Price at Risk of Extended Decline as Bears Regain Control
Ethereum price started a downside correction below the $1,850 zone. ETH is now consolidating and might drop further below the $1,785 support zone. Ethereum started a fresh decline below the $1,850 and $1,820 levels. The...
Archive context
Older archive item. Useful for background and entity history, but not a fresh market-moving signal.

Ethereum price started a downside correction below the $1,850 zone. ETH is now consolidating and might drop further below the $1,785 support zone.
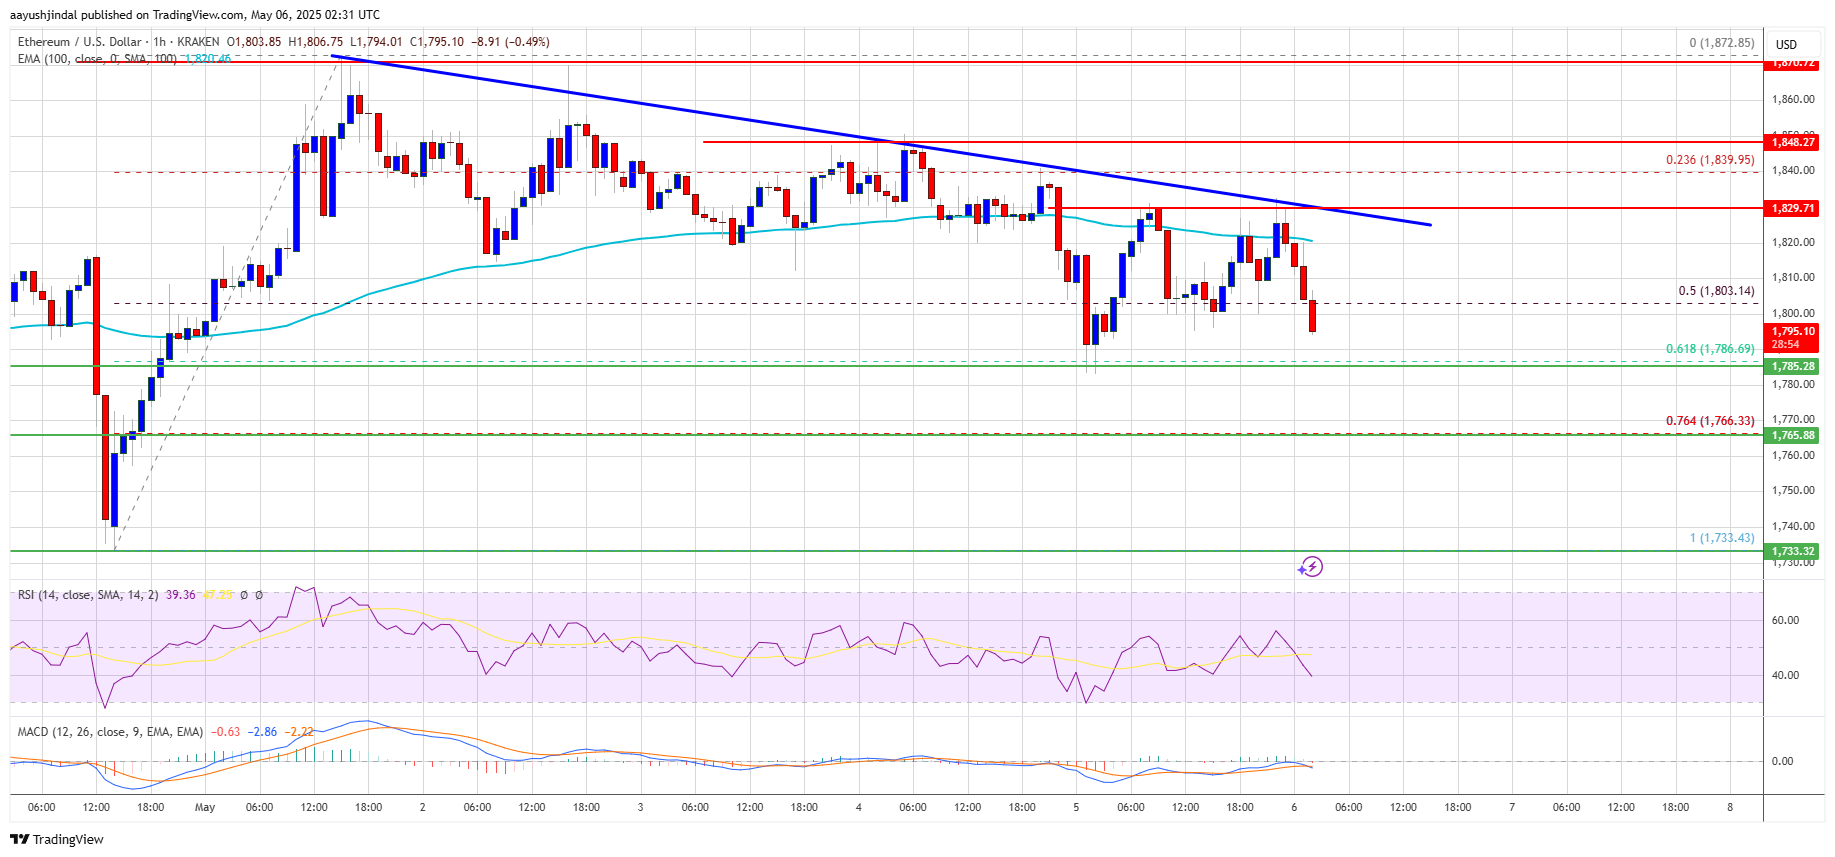
- Ethereum started a fresh decline below the $1,850 and $1,820 levels.
- The price is trading below $1,800 and the 100-hourly Simple Moving Average.
- There is a key bearish trend line forming with resistance at $1,830 on the hourly chart of ETH/USD (data feed via Kraken).
- The pair could continue to move down if it breaks the $1,785 support level.
Ethereum price failed to clear the $1,880 resistance and started a downside correction, like Bitcoin. ETH declined below the $1,850 and $1,820 support levels.
There was a move below the 50% Fib retracement level of the upward move from the $1,734 swing low to the $1,872 high. The bears even pushed the price below the $1,800 level, but the price found support near the $1,785 support level.
Ethereum price is now trading below $1,800 and the 100-hourly Simple Moving Average. There is also a key bearish trend line forming with resistance at $1,830 on the hourly chart of ETH/USD.
On the upside, the price seems to be facing hurdles near the $1,820 level. The next key resistance is near the $1,830 level and the trend line. The first major resistance is near the $1,880 level.
A clear move above the $1,880 resistance might send the price toward the $1,920 resistance. An upside break above the $1,920 resistance might call for more gains in the coming sessions. In the stated case, Ether could rise toward the $2,000 resistance zone or even $2,050 in the near term.
More Losses In ETH?If Ethereum fails to clear the $1,830 resistance, it could start a fresh decline. Initial support on the downside is near the $1,785 level and the 61.8% Fib retracement level of the upward move from the $1,734 swing low to the $1,872 high. The first major support sits near the $1,750 zone.
A clear move below the $1,750 support might push the price toward the $1,720 support. Any more losses might send the price toward the $1,685 support level in the near term. The next key support sits at $1,640.
Technical Indicators
Hourly MACD – The MACD for ETH/USD is gaining momentum in the bearish zone.
Hourly RSI – The RSI for ETH/USD is now below the 50 zone.
Major Support Level – $1,765
Major Resistance Level – $1,830
Why this matters
This ethereum story adds another data point to the current market tape and is useful when read alongside nearby source coverage.
Original source
Read on NewsBTCRelated market context

Leading Claude AI Fable 5 Predicts Stunning XRP Price by The End of 2026
Anthropic’s new Claude AI model, Fable 5, predicts XRP price for the entire second half around a single event that could be resolv...

Mark Zuckerberg’s Meta AI Predicts Unbelievable Bitcoin Price by the End of 2026
Mark Zuckerberg’s Meta AI predicts and stacks 4 numbered catalysts behind its Bitcoin price prediction that puts $120,000 to $150,...

Bitcoin whales send 49,000 BTC to exchanges as $60K rebound shows signs of weakness
Bitcoin’s recovery above $60,000 is facing a fresh test from exchange-flow and derivatives data after large holders moved one of t...

Vitalik Buterin unveils “Lean Ethereum” roadmap for quantum resistance by 2029
Ethereum's proactive roadmap enhances its resilience and appeal, potentially boosting market confidence and investment in its futu...

Bitcoin Price Prediction: Saylor’s Strategy is a Risk to Bitcoin, According to JP Morgan
JPMorgan has flagged a structural risk most Bitcoin price prediction bulls haven’t priced in: the same entity driving the most agg...

Micron stock soars nearly 700% in a year as tokenized version trades on Ethereum via Ondo
Micron's stock surge and tokenization highlight the growing intersection of traditional finance and decentralized finance, impacti...