Ethereum Price Drops After Bullish Attempt — Support Area Under Pressure
Ethereum price started a fresh decline from the $2,520 zone. ETH is now back below $2,450 and struggling to stay above the $2,350 support. Ethereum started a fresh decline from the $2,520 level. The price is trading belo...
Archive context
Older archive item. Useful for background and entity history, but not a fresh market-moving signal.

Ethereum price started a fresh decline from the $2,520 zone. ETH is now back below $2,450 and struggling to stay above the $2,350 support.
- Ethereum started a fresh decline from the $2,520 level.
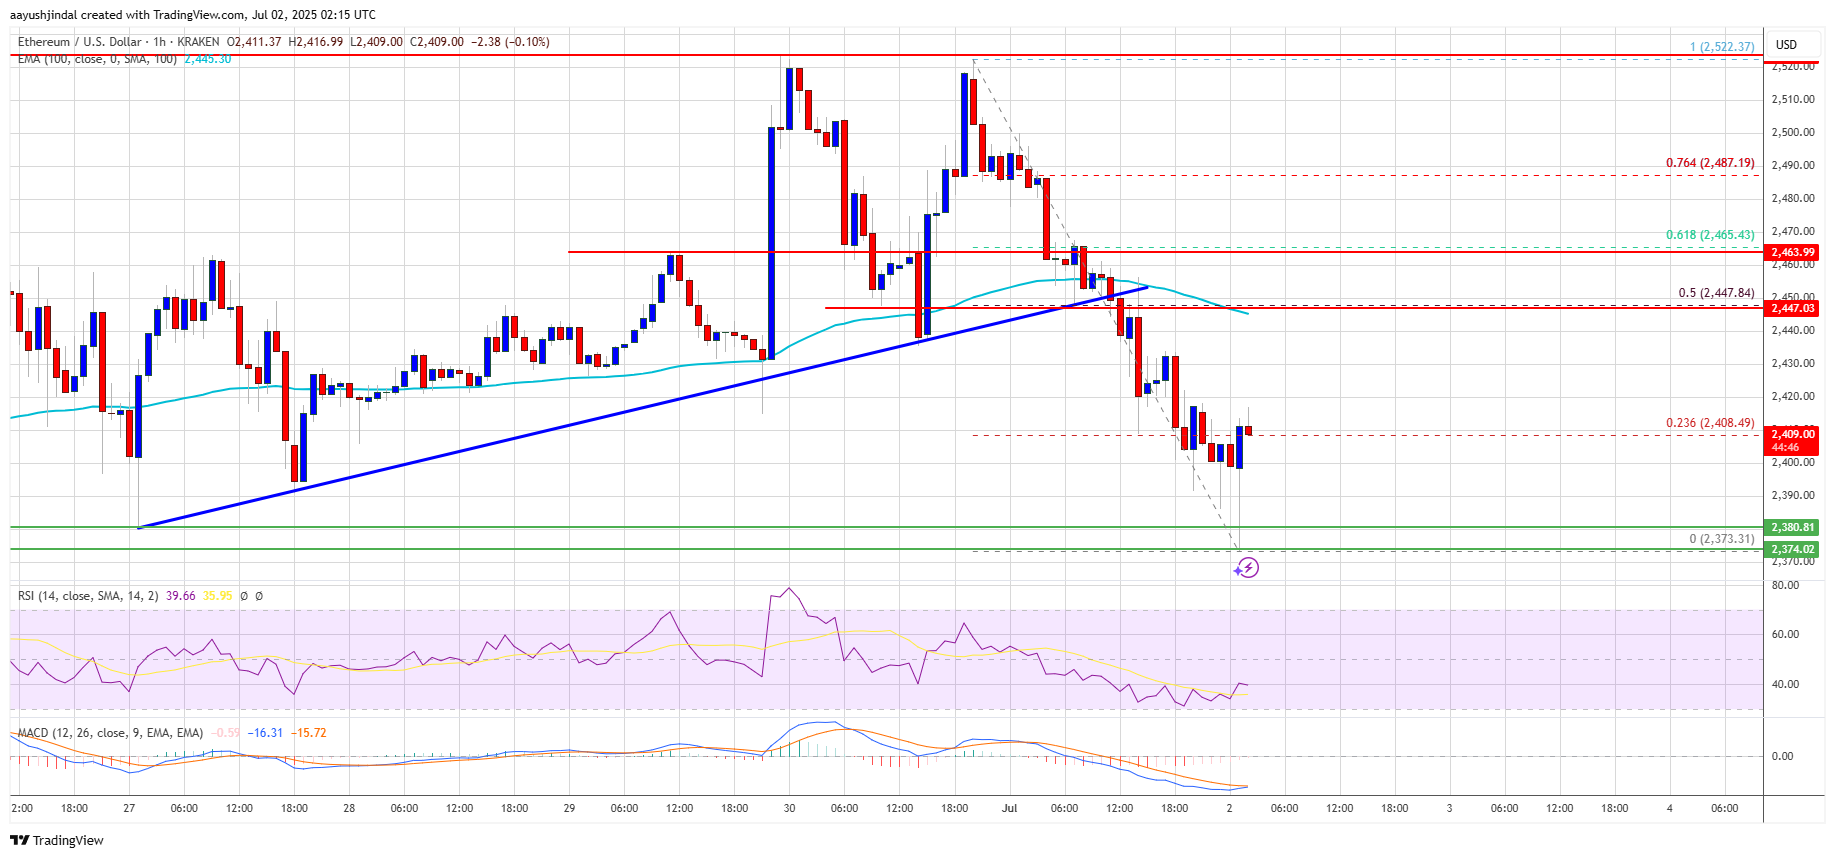
- The price is trading below $2,450 and the 100-hourly Simple Moving Average.
- There was a break below a key bullish trend line with support at $2,450 on the hourly chart of ETH/USD (data feed via Kraken).
- The pair could start a fresh increase if it remains stable above the $2,350 zone in the near term.
Ethereum price started a fresh decline from the $2,520 resistance, like Bitcoin. ETH price declined below the $2,500 and $2,450 levels to enter a short-term bearish zone.
Besides, there was a break below a key bullish trend line with support at $2,450 on the hourly chart of ETH/USD. The pair even spiked below the $2,400 level. A low was formed at $2,373 and the price is now attempting to recover some losses.
It climbed above the 23.6% Fib retracement level of the downward move from the $2,523 swing high to the $2,373 low. Ethereum price is now trading below $2,450 and the 100-hourly Simple Moving Average.
On the upside, the price could face resistance near the $2,420 level. The next key resistance is near the $2,450 level. It is close to the 50% Fib retracement level of the downward move from the $2,523 swing high to the $2,373 low. The first major resistance is near the $2,465 level. A clear move above the $2,465 resistance might send the price toward the $2,520 resistance.
An upside break above the $2,520 resistance might call for more gains in the coming sessions. In the stated case, Ether could rise toward the $2,550 resistance zone or even $2,650 in the near term.
Another Decline In ETH?If Ethereum fails to clear the $2,450 resistance, it could start a fresh decline. Initial support on the downside is near the $2,375 level. The first major support sits near the $2,350 zone.
A clear move below the $2,350 support might push the price toward the $2,280 support. Any more losses might send the price toward the $2,220 support level in the near term. The next key support sits at $2,150.
Technical Indicators
Hourly MACD – The MACD for ETH/USD is losing momentum in the bearish zone.
Hourly RSI – The RSI for ETH/USD is now below the 50 zone.
Major Support Level – $2,350
Major Resistance Level – $2,450
Why this matters
This ethereum story adds another data point to the current market tape and is useful when read alongside nearby source coverage.
Original source
Read on NewsBTCRelated market context

Bitcoin (BTC) Price Prediction: BTC Holds $63K Support—Can Rising Active Addresses Offset Bearish Technical Signals?
Although the BTC price has remained near a key support zone, recent chart signals and Strategy’s sale of a portion of its Bitcoin...

XRP Price Prediction: Volume and ETF Inflow Send Ripple Token Higher
XRP price pushed above the $1.14 resistance area after buyers stepped in with heavy volume and bullish prediction. The token climb...

Sui DeFi TVL Breaks $1 Billion As Move-Based Chains Fight For Liquidity
Sui has crossed the $1 billion total value locked mark on DeFiLlama, giving the Move-based network a clearer claim to serious DeFi...

Dormant $1.9M Bitcoin tied to New York lawsuit moves after nearly 15 years
A Bitcoin address dormant for nearly 15 years moved $1.9 million in BTC as a New York lawsuit seeks ownership of thousands of inac...

Bitcoin miner bottom signal now depends on who survives weak mining profits
A Bitcoin miner-stress signal circulating on X has fallen into a zone analysts associate with severe miner pressure, putting a fam...

New SummerFi DeFi exploit shows AI automation now sits above smart contract risk
Summer.fi's automated vault incident has put delegated DeFi yield back under pressure after Blockaid said on July 6 that its explo...