Technical Analysis: GALA Climbs 16%, Qtum Leads Tuesday’s Bulls
GALA was one of Tuesday’s big gainers, as cryptocurrency markets were once again trending upwards. Overall, the cryptocurrency market capitalization is around 4% higher as of writing. Biggest gainers On Tuesday, crypto m...
Archive context
Older archive item. Useful for background and entity history, but not a fresh market-moving signal.

GALA was one of Tuesday’s big gainers, as cryptocurrency markets were once again trending upwards. Overall, the cryptocurrency market capitalization is around 4% higher as of writing.
Biggest gainersOn Tuesday, crypto markets were green across the board, as traders once again re-entered the marketplace following the uncertainty caused by the tensions between Russia and Ukraine.
Gala (GALA) was one of these bulls, climbing by as much as 16% earlier in the session, however it was qtum (QTUM) which led today’s gainers.
QTUM/USD, which was trading at a low of $6.33 on Monday, climbed to an intraday high of $8.15 earlier today.
Today’s move came as the price of QTUM rallied from support of $6.35, all the way towards resistance of $7.90 and beyond.
However, as prices hit the recent ceiling, profit-takers began to liquidate their positions, which led to QTUM falling from its high.
This came as price strength also found some resistance, with the 14-day RSI hitting its ceiling of 56, an area which has acted as a point of uncertainty in the past.
Some bulls are likely to still remain in QTUM/USD, in hopes that a breakout of this resistance will take prices above $9.
Biggest losersAs the majority of the crypto top 100 was trading higher on Tuesday, finding a bear was no mean feat.
Tuesday’s biggest loser, relatively speaking, was symbol (XYM), which fell by close to 0.70% on the day.
The price of XYM/USD, which hit a high of $0.1782 yesterday, fell to an intraday low of $0.1725 on Monday, as markets seem to be heading for support.
This came as price strength weighed at the 45.15 ceiling of the RSI, with bears pushing momentum lower.
In addition to this, the moving averages of 10-days, and 25-days appear to be set for a downward cross, which could mean the floor of $0.1616 may not only be hit, but potentially broken.
Could bulls be set to buy at the support level? Let us know your thoughts in the comments.
Why this matters
This research story adds another data point to the current market tape and is useful when read alongside nearby source coverage.
Original source
Read on Bitcoin NewsRelated market context

XRP Price Prediction: Ripple’s $700M Escrow Return Puts $1.59 Resistance in the Spotlight
The setup comes shortly after Ripple returned 700 million XRP, worth more than $1 billion, to escrow following its scheduled Octob...

Binance will hold some Brazil crypto deposits until users explain where the money came from
Binance will require Brazilian users to provide additional information for cross-border crypto transfers starting Nov. 1. The exch...

XRP Price Prediction: Ripple Range-Bound at $1.50, Breakout Soon?
XRP price prediction shows Ripple entering October still trading within a broad range. XRP is currently around $1.50, with key res...

Bitcoin Price Stays Out of the Red as This Bear Market Breaks a Historic Pattern
Bitcoin price drawdown never produced a daily close below realized price this cycle, while aggregate NUPL remained positive throug...

Bitcoin Price Prediction: To The Moon and Back, $87K Rally Canceled
BTC’s push toward $87,000 has run into sellers again. Bitcoin is trading at $85,500 after reaching as high as $87,000, which moves...
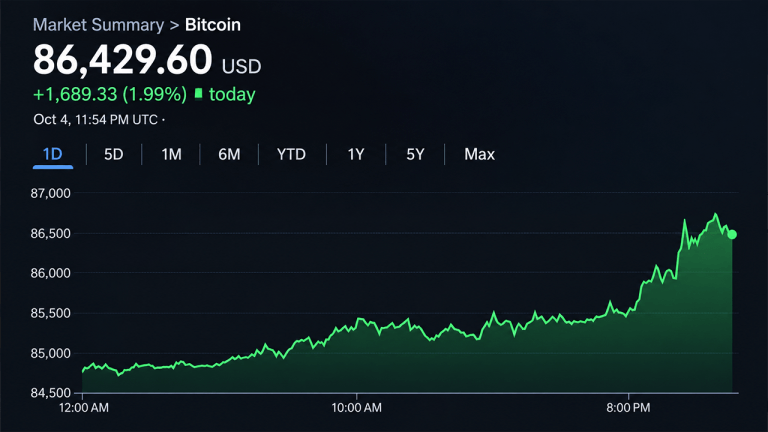
Bitcoin Price Knocks on $87K as Uptober Bulls Smell $94K
Bitcoin’s price is putting Uptober’s reputation back on trial. After closing September near $83,560, the leading crypto asset ripp...