Ethereum Price Indicators Show Vulnerability to Bigger Correction
Ethereum price started a fresh decline from the $1,940 resistance against the US Dollar. ETH retested $1,825 and is showing a few bearish signs. Ethereum struggled to settle above the $1,925 and $1,940 resistance levels....

Ethereum price started a fresh decline from the $1,940 resistance against the US Dollar. ETH retested $1,825 and is showing a few bearish signs.
- Ethereum struggled to settle above the $1,925 and $1,940 resistance levels.
- The price is trading below $1,880 and the 100-hourly Simple Moving Average.
- There was a break below a key bullish trend line with support near $1,895 on the hourly chart of ETH/USD (data feed via Kraken).
- The pair could continue to move down if it clears the $1,800 support zone.
Ethereum’s price started a fresh increase above the $1,850 zone. ETH struggled to settle above the $1,925 and $1,940 resistance levels, similar to Bitcoin at $29,500.
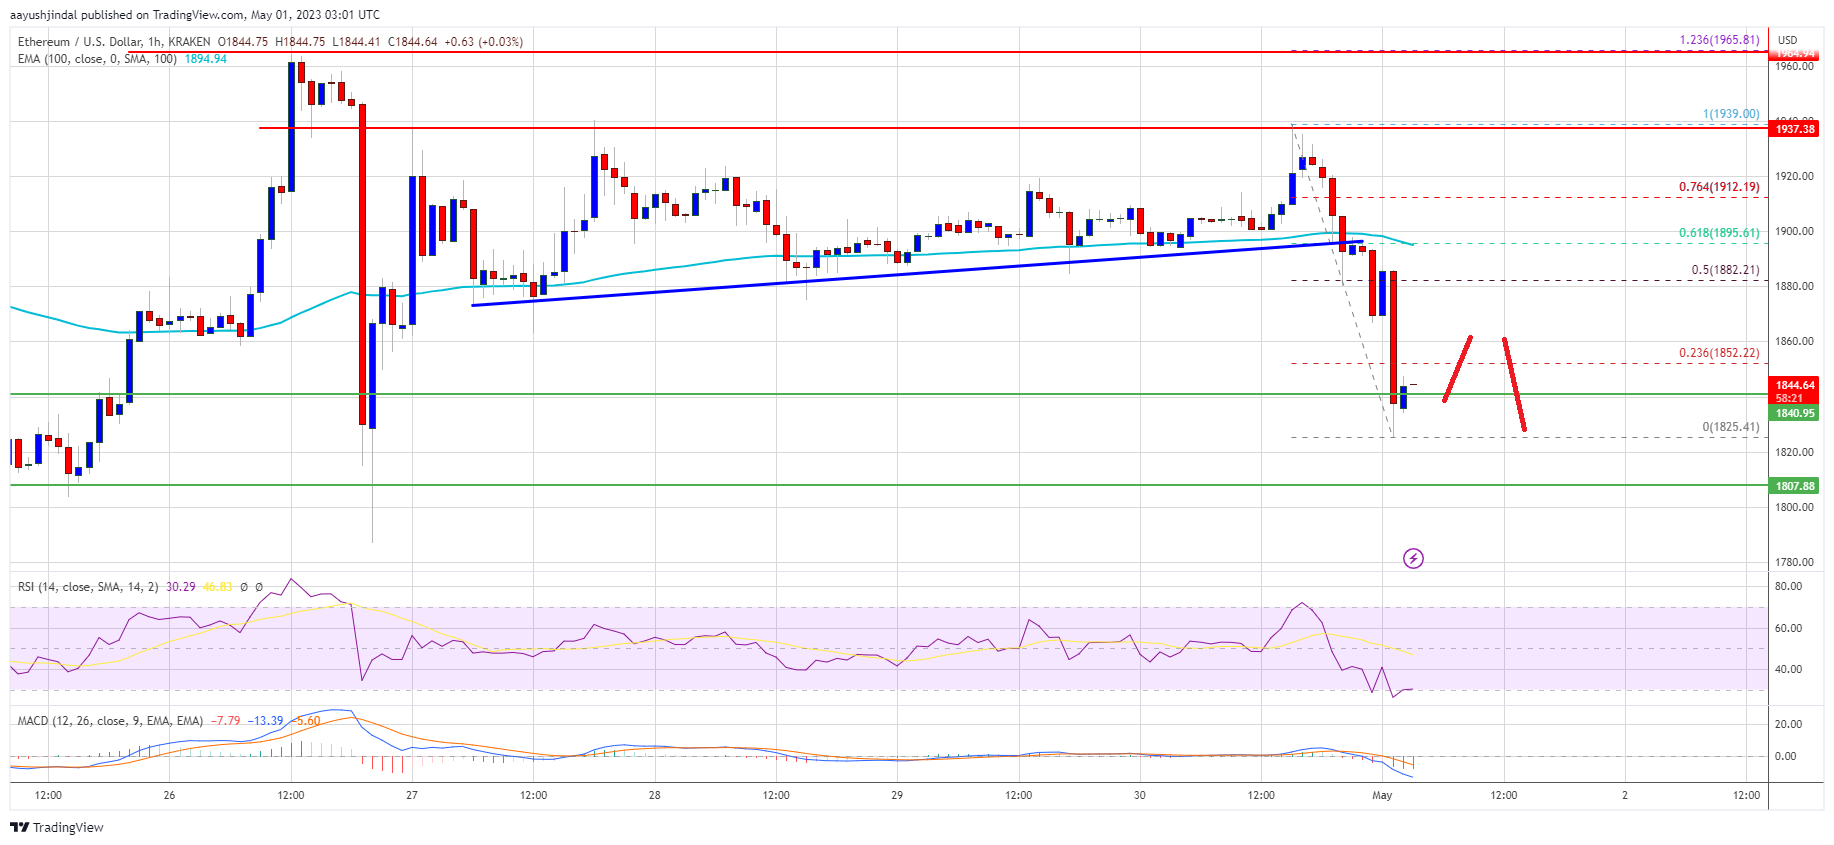
A high was formed near $1,939 and the price started a fresh decline. There was a sharp decline below the $1,900 and $1,880 levels. Besides, there was a break below a key bullish trend line with support near $1,895 on the hourly chart of ETH/USD.
A low is formed near $1,825 and the price is now consolidating losses. Ether price is now trading below $1,880 and the 100-hourly Simple Moving Average.
Immediate resistance is near the $1,850 level. It is close to the 23.6% Fib retracement level of the recent decline from the $1,939 swing high to the $1,825 low. The next major resistance seems to be forming near $1,900 and the 100-hourly Simple Moving Average.
Source: ETHUSD on TradingView.com
The 50% Fib retracement level of the recent decline from the $1,939 swing high to the $1,825 low is also near the $1,900 level. A close above the $1,900 level might start a fresh increase. In the stated case, the price could rise toward the $1,940 resistance. Any more gains could send Ether toward the $2,000 resistance.
More Losses in ETH?If Ethereum fails to clear the $1,900 resistance, it could continue to move down. Initial support on the downside is near the $1,825 level.
The next major support is near the $1,800 zone, below which ether price might drop toward the $1,740 support zone. Any more losses may perhaps take the price toward $1,700 in the near term.
Technical Indicators
Hourly MACD – The MACD for ETH/USD is now gaining momentum in the bearish zone.
Hourly RSI – The RSI for ETH/USD is well below the 50 level.
Major Support Level – $1,800
Major Resistance Level – $1,900
Original source
Read on NewsBTCRelated market context

Bitcoin price challenges $64,000 weekend wall – needing a breakout or risk a deeper correction
Bitcoin reclaimed $64,000 on June 12 and touched an intraday high of $64,301 in the same session that spot ETF flows finally flipp...

Standard Chartered Says Bitcoin Bottomed Near $59,000 As Crypto Winter Ends
TL;DR Standard Chartered’s Geoffrey Kendrick reportedly says Bitcoin’s $59,000 area marked the cycle bottom. The note cites SpaceX...

Bitcoin rises above $64,000 after Pakistan prime minister says Iran peace deal is near
Bitcoin traded above $64,000 on Saturday, supported by its strongest ETF inflows in a month and growing optimism around geopolitic...

US forces shoot down Iranian attack drones near Strait of Hormuz, Bitcoin drops below $73K
Geopolitical tensions near vital oil routes can destabilize financial markets, highlighting the interconnectedness of global secur...

XRP aims for $0.90 as ETF demand battles selling pressure from whales
XRP is trading at $1.11, down roughly 17% from its June opening, having set a new 2026 low on June 5 and shed $8 billion in market...

Google Gemini AI Predicts Jaw-Dropping XRP Price For Next 90 Days
Google Gemini AI just put XRP back under the spotlight, predicting it is tightly wound for a major breakout toward $1.60 to $1.80...