XRP Moves Higher – Approaching Resistance That Could Decide Next Trend
XRP price is attempting a recovery wave above the $2.850 zone. The price now faces a couple of key hurdles near $2.920 and $2.950. XRP price is slowly moving higher above the $2.850 support zone. The price is now trading...
Archive context
Older archive item. Useful for background and entity history, but not a fresh market-moving signal.

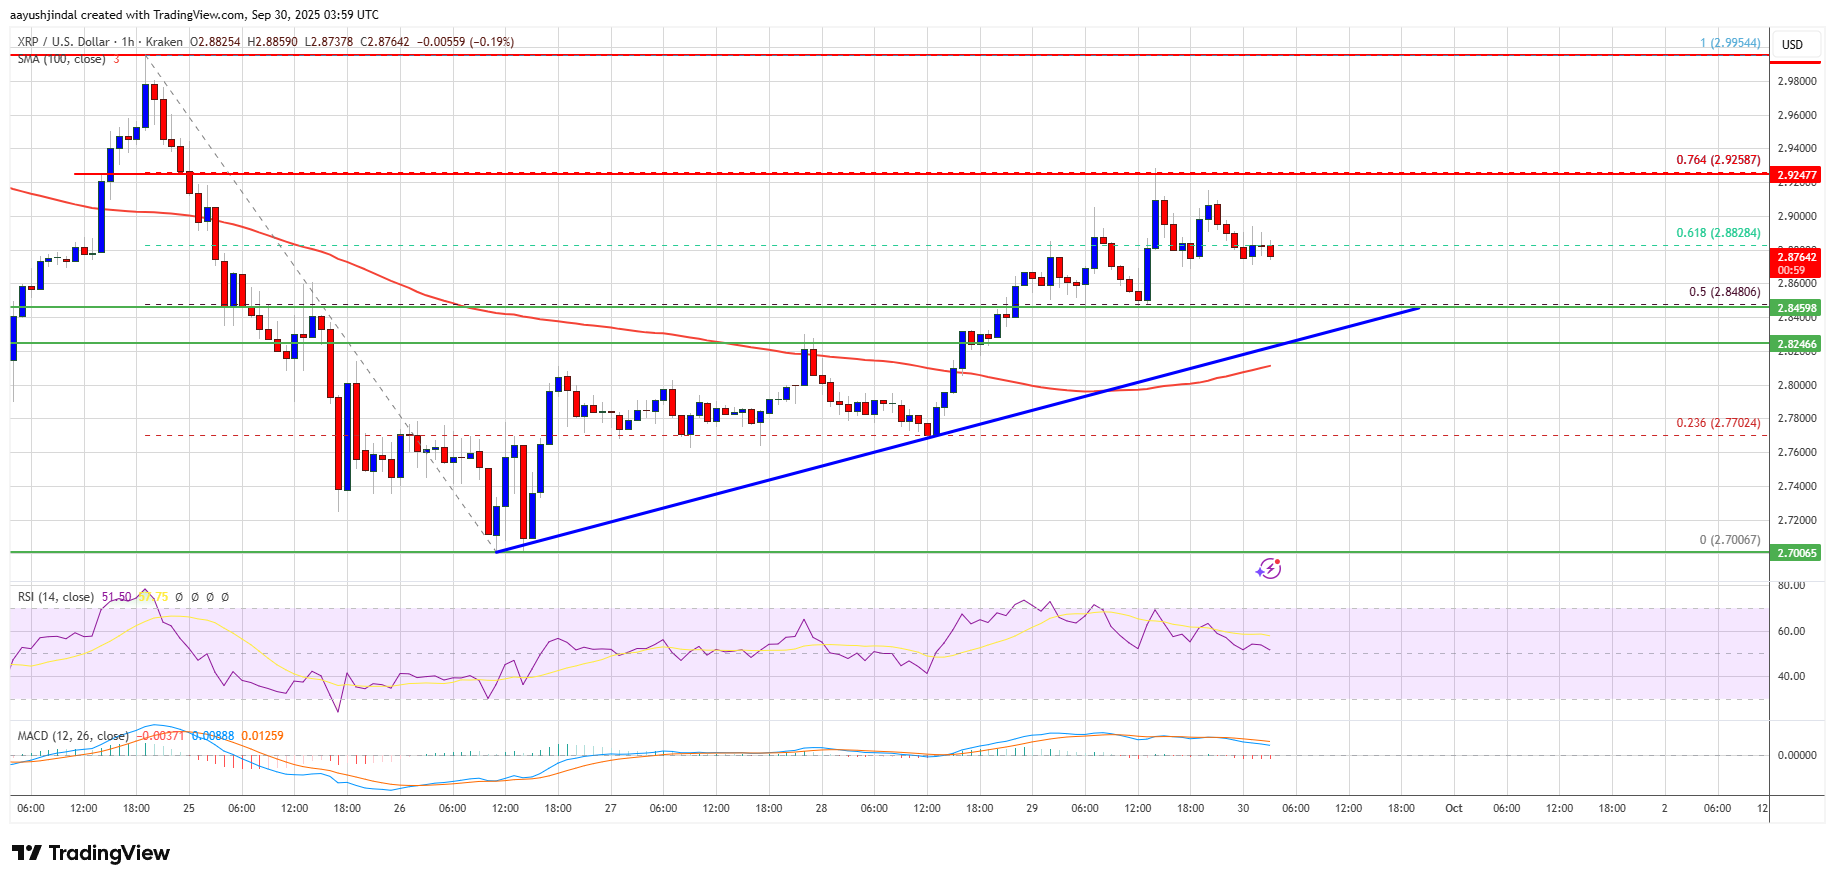
XRP price is attempting a recovery wave above the $2.850 zone. The price now faces a couple of key hurdles near $2.920 and $2.950.
- XRP price is slowly moving higher above the $2.850 support zone.
- The price is now trading above $2.850 and the 100-hourly Simple Moving Average.
- There is a connecting bullish trend line forming with support at $2.8320 on the hourly chart of the XRP/USD pair (data source from Kraken).
- The pair could continue to move up if it settles above $2.920.
XRP price started a recovery wave after it found support above $2.720 and $2.770, like Bitcoin and Ethereum. The price was able to surpass the $2.80 and $2.850 resistance levels.
There was a clear move above the 61.8% Fib retracement level of the downward wave from the $2.995 swing high to the $2.70 low. The bulls even pushed the price toward $2.920 before they faced resistance. Besides, there is a connecting bullish trend line forming with support at $2.8320 on the hourly chart of the XRP/USD pair.
The price is now trading above $2.850 and the 100-hourly Simple Moving Average. On the upside, the price might face resistance near the $2.925 level or the 76.4% Fib retracement level of the downward wave from the $2.995 swing high to the $2.70 low.
The first major resistance is near the $2.950 level. A clear move above the $2.950 resistance might send the price toward the $3.00 resistance. Any more gains might send the price toward the $3.050 resistance. The next major hurdle for the bulls might be near $3.120.
Another Decline?If XRP fails to clear the $2.920 resistance zone, it could start a fresh decline. Initial support on the downside is near the $2.850 level. The next major support is near the $2.8320 level and the trend line.
If there is a downside break and a close below the $2.8320 level, the price might continue to decline toward $2.770. The next major support sits near the $2.720 zone, below which the price could continue lower toward $2.650.
Technical Indicators
Hourly MACD – The MACD for XRP/USD is now gaining pace in the bullish zone.
Hourly RSI (Relative Strength Index) – The RSI for XRP/USD is now above the 50 level.
Major Support Levels – $2.8320 and $2.770.
Major Resistance Levels – $2.920 and $2.950.
Why this matters
This altcoin story adds another data point to the current market tape and is useful when read alongside nearby source coverage.
Original source
Read on NewsBTCRelated market context

XRP Price Prediction: XRP Faces Critical Resistance Near $1.17 Despite Ripple Securing Landmark EU License
While the company secured a full MiCA license that expands its operations across the European Economic Area, market indicators sug...

XRP Reclaims A Key Support Zone As Traders Watch Open Interest Build
XRP has moved back into a zone traders are watching closely, with the $0.50 area acting as the line that decides whether the lates...

Cardano Price Prediction: ADA Pulls Back to $0.17 After a Strong Weekly Rally as Bulls Watch $0.20 and $0.22 Reclaim
Cardano price is trading near $0.17 after a weaker 24-hour session, according to Brave New Coin data. ADA is down around 4.84% on...

Sam Altman ChatGPT AI Predicts Insane Bitcoin Price by 2026
Sam Altman ChatGPT AI just circled November on the calendar and put a number next to Bitcoin Price Prediction. The model predicts...

Elon Musk Grok AI Predicts Incredible XRP Price Target by End of 2026
Elon Musk Grok AI just published what might be the most partnership-heavy XRP price prediction in this entire series. The model pr...

Germany’s Bitcoin Wallet Nears The End Of Its Selloff Overhang
Germany’s seized Bitcoin wallet has been one of the market’s most obvious supply stories. Now the discussion is starting to change...