XRP Price Stability Signals Opportunity – Is a Fresh Breakout on the Horizon?
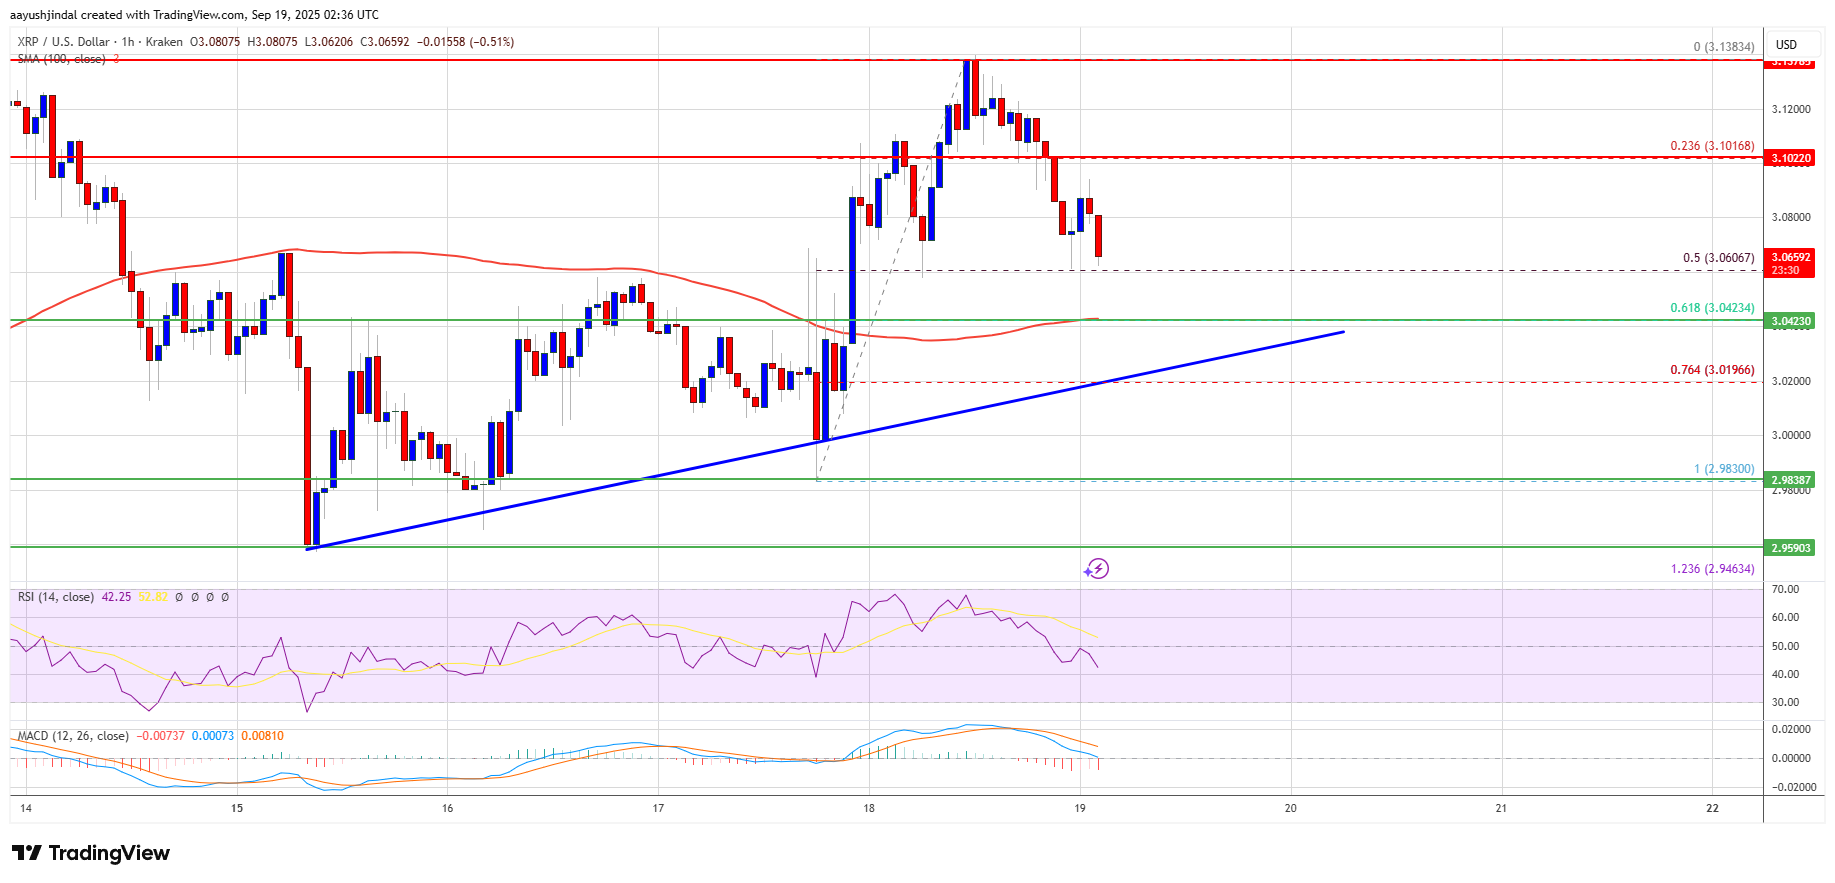
XRP price started a fresh increase above the $3.050 resistance. The price is now correcting some gains and might find bids near the $3.020 zone. XRP price is moving higher above the $3.00 support zone. The price is now t...
Archive context
Older archive item. Useful for background and entity history, but not a fresh market-moving signal.

XRP price started a fresh increase above the $3.050 resistance. The price is now correcting some gains and might find bids near the $3.020 zone.
- XRP price is moving higher above the $3.00 support zone.
- The price is now trading above $3.050 and the 100-hourly Simple Moving Average.
- There is a bullish trend line forming with support at $3.040 on the hourly chart of the XRP/USD pair (data source from Kraken).
- The pair could continue to move up if it clears the $3.120 zone.
XRP price remained support above $2.950 and started a fresh increase, like Bitcoin and Ethereum. The price climbed above the $3.020 and $3.080 levels.
The bulls even pushed the price above $3.120. A high was formed at $3.138 and the price is now correcting some gains. There was a move below the $3.10 level. The price tested the 50% Fib retracement level of the upward move from the $2.9830 swing low to the $3.138 high.
The price is now trading above $3.050 and the 100-hourly Simple Moving Average. Besides, there is a bullish trend line forming with support at $3.040 on the hourly chart of the XRP/USD pair.
If the bulls protect the $3.050 support, the price could attempt another increase. On the upside, the price might face resistance near the $3.10 level. The first major resistance is near the $3.120 level. A clear move above the $3.120 resistance might send the price toward the $3.20 resistance. Any more gains might send the price toward the $3.2320 resistance. The next major hurdle for the bulls might be near $3.250.
More Downside?If XRP fails to clear the $3.10 resistance zone, it could continue to move down. Initial support on the downside is near the $3.050 level or the 61.8% Fib retracement level of the upward move from the $2.9830 swing low to the $3.138 high. The next major support is near the $3.020 level.
If there is a downside break and a close below the $3.020 level, the price might continue to decline toward $2.980. The next major support sits near the $2.9150 zone, below which the price could gain bearish momentum.
Technical Indicators
Hourly MACD – The MACD for XRP/USD is now losing pace in the bullish zone.
Hourly RSI (Relative Strength Index) – The RSI for XRP/USD is now below the 50 level.
Major Support Levels – $3.050 and $3.00.
Major Resistance Levels – $3.10 and $3.120.
Why this matters
This altcoin story adds another data point to the current market tape and is useful when read alongside nearby source coverage.
Original source
Read on NewsBTCRelated market context

XRP Price Prediction: XRP Faces Critical Resistance Near $1.17 Despite Ripple Securing Landmark EU License
While the company secured a full MiCA license that expands its operations across the European Economic Area, market indicators sug...

Ethereum Price Stabilizes as Tether Burns $2.5 Billion USDT Stablecoins
Ethereum is slipping by more than 2% as massive $2.5 billion USDT burn on Ethereum dragged its price prediction down. Although ETH...

Sam Altman ChatGPT AI Predicts Insane Bitcoin Price by 2026
Sam Altman ChatGPT AI just circled November on the calendar and put a number next to Bitcoin Price Prediction. The model predicts...

Ethereum’s treasury boom now has one company nearing 5% of supply
Ethereum treasury company BitMine said it now holds 5,742,237 ETH, or 4.8% of Ethereum's (ETH) 120.7 million token supply, putting...

Ethereum is losing ownership of crypto payments as Base moves $565B in stablecoins
Stablecoin activity is becoming a contest over which blockchains move the most tokenized dollars. Visa Onchain Analytics showed th...

Crypto News, July 8: U.S. Strikes Iran Again, Ethereum Price Wobbles After Bitcoin Spot Sell-Off
Crypto markets woke up to fresh news as U.S. strikes hit Iran again. The Bitcoin price is stuck chopping between $62,000 and $64,5...