Bitcoin Cash Price Solid 15% Gain: Signs Point to Fresh BCH Rally Ahead
Bitcoin Cash price rallied over 15% and broke the $275 resistance. BCH is now facing strong resistance near the $282 zone. Bitcoin cash price started a fresh surge above the $250 resistance. The price is trading above $2...
Archive context
Older archive item. Useful for background and entity history, but not a fresh market-moving signal.
Bitcoin Cash price rallied over 15% and broke the $275 resistance. BCH is now facing strong resistance near the $282 zone.
- Bitcoin cash price started a fresh surge above the $250 resistance.
- The price is trading above $265 and the 100 simple moving average (4 hours).
- There is a key bullish trend line forming with support at $258 on the 4-hour chart of the BCH/USD pair (data feed from Kraken).
- The pair could continue to move up if it clears the $282 resistance zone.
After forming a base above the $232 level, Bitcoin Cash price started a steady increase. It broke the $245 resistance to enter a positive zone, like Bitcoin and Ethereum.
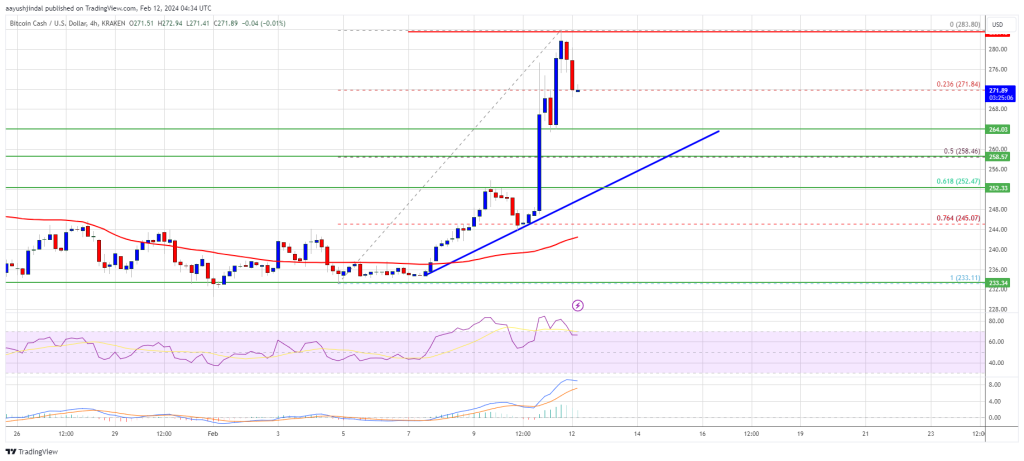
There was a strong increase above the $250 and $265 resistance levels. The price gained over 15% and tested the $282 resistance. A high was formed near $283 and the price is now correcting gains. There was a move below the $275 level.
The price tested the 23.6% Fib retracement level of the upward move from the $233 swing low to the $283 high. BCH is now showing positive signs above $260 and the 100 simple moving average (4 hours).
Source: BCH/USD on TradingView.com
There is also a key bullish trend line forming with support at $258 on the 4-hour chart of the BCH/USD pair. If there is another increase, the price might face resistance near $275. To continue higher, the price must settle above $282. The next major resistance is near $292, above which the price might accelerate higher toward the $300 level. Any further gains could lead the price toward the $320 resistance zone.
Fresh Drop in BCH?If Bitcoin Cash price fails to clear the $275 resistance, it could start a fresh decline. Initial support on the downside is near the $265 level.
The next major support is near the $258 level or the trend line. It is close to the 50% Fib retracement level of the upward move from the $233 swing low to the $283 high, where the bulls are likely to appear. If the price fails to stay above the $258 support, the price could test the $245 support. Any further losses could lead the price toward the $232 zone in the near term.
Technical indicators
4-hour MACD – The MACD for BCH/USD is losing pace in the bullish zone.
4-hour RSI (Relative Strength Index) – The RSI is currently in the overbought zone.
Key Support Levels – $265 and $258.
Key Resistance Levels – $275 and $282.
Why this matters
This bitcoin story adds another data point to the current market tape and is useful when read alongside nearby source coverage.
Original source
Read on NewsBTCRelated market context

Ethereum Price Stabilizes as Tether Burns $2.5 Billion USDT Stablecoins
Ethereum is slipping by more than 2% as massive $2.5 billion USDT burn on Ethereum dragged its price prediction down. Although ETH...

XRP Reclaims A Key Support Zone As Traders Watch Open Interest Build
XRP has moved back into a zone traders are watching closely, with the $0.50 area acting as the line that decides whether the lates...

Cardano Price Prediction: ADA Pulls Back to $0.17 After a Strong Weekly Rally as Bulls Watch $0.20 and $0.22 Reclaim
Cardano price is trading near $0.17 after a weaker 24-hour session, according to Brave New Coin data. ADA is down around 4.84% on...

Ethereum’s treasury boom now has one company nearing 5% of supply
Ethereum treasury company BitMine said it now holds 5,742,237 ETH, or 4.8% of Ethereum's (ETH) 120.7 million token supply, putting...

Crypto News, July 8: U.S. Strikes Iran Again, Ethereum Price Wobbles After Bitcoin Spot Sell-Off
Crypto markets woke up to fresh news as U.S. strikes hit Iran again. The Bitcoin price is stuck chopping between $62,000 and $64,5...
XRP cleaned out leverage, now ETF demand has to prove itself
XRP’s late-June washout removed a major source of market instability: excess leverage that could have turned another sharp move in...