Bitcoin Faces Pressure – Could The Price Resume Its Downtrend Soon?
Bitcoin price corrected losses and traded above the $114,200 level. BTC is now struggling and might face hurdles near the $116,000 level. Bitcoin started a recovery wave above the $114,000 resistance level. The price is...
Archive context
Older archive item. Useful for background and entity history, but not a fresh market-moving signal.
Bitcoin price corrected losses and traded above the $114,200 level. BTC is now struggling and might face hurdles near the $116,000 level.
- Bitcoin started a recovery wave above the $114,000 resistance level.
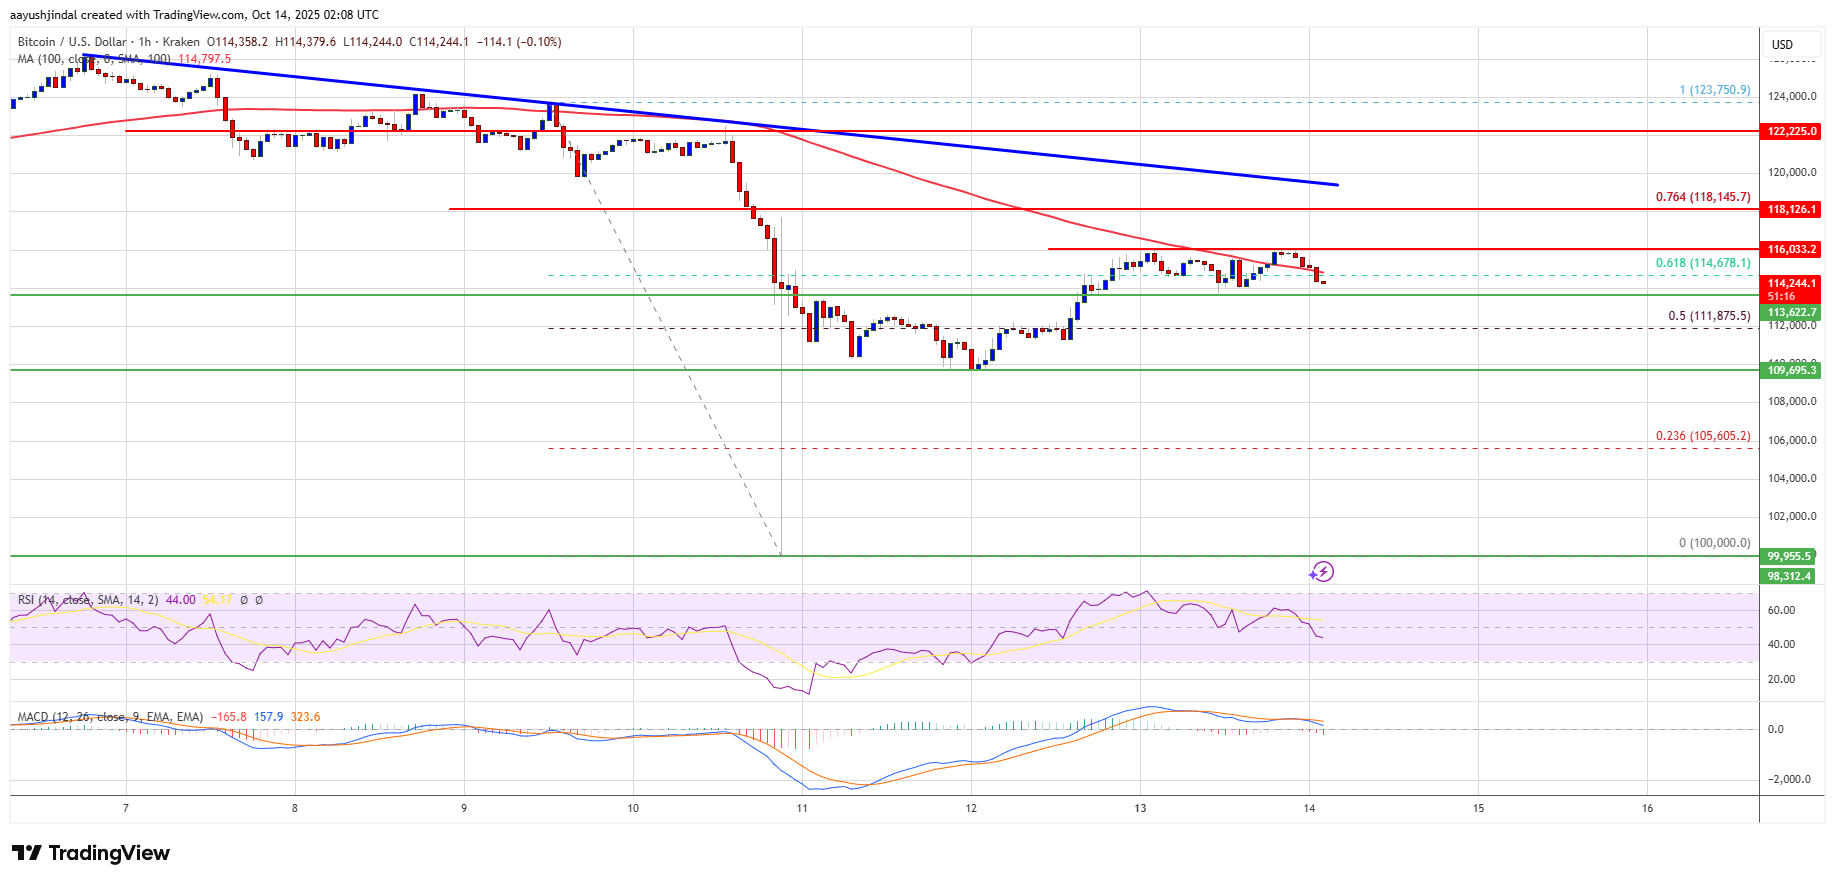
- The price is trading below $115,000 and the 100 hourly Simple moving average.
- There is a bearish trend line forming with resistance at $119,250 on the hourly chart of the BTC/USD pair (data feed from Kraken).
- The pair might continue to move down if it trades below the $112,500 zone.
Bitcoin price started a recovery wave above the $110,000 pivot level. BTC recovered above the $112,500 and $113,200 resistance levels.
The price climbed above the 50% Fib retracement level of the main drop from the $123,750 swing high to the $100,000 low. The bulls even pushed the price above the $114,000 resistance level. However, there are many hurdles on the upside.
Bitcoin is now trading below $116,000 and the 100 hourly Simple moving average. Besides, there is a bearish trend line forming with resistance at $119,250 on the hourly chart of the BTC/USD pair.
Immediate resistance on the upside is near the $115,000 level. The first key resistance is near the $116,000 level. The next resistance could be $118,150 and the 76.4% Fib retracement level of the main drop from the $123,750 swing high to the $100,000 low.
A close above the $118,150 resistance might send the price further higher. In the stated case, the price could rise and test the $119,250 resistance and the trend line. Any more gains might send the price toward the $120,000 level. The next barrier for the bulls could be $122,500.
Another Drop In BTC?If Bitcoin fails to rise above the $115,000 resistance zone, it could start a fresh decline. Immediate support is near the $113,600 level. The first major support is near the $112,500 level.
The next support is now near the $111,200 zone. Any more losses might send the price toward the $110,500 support in the near term. The main support sits at $110,000, below which BTC might struggle to recover in the short term.
Technical indicators:
Hourly MACD – The MACD is now gaining pace in the bearish zone.
Hourly RSI (Relative Strength Index) – The RSI for BTC/USD is now below the 50 level.
Major Support Levels – $113,500, followed by $112,500.
Major Resistance Levels – $115,000 and $116,000.
Why this matters
This bitcoin story adds another data point to the current market tape and is useful when read alongside nearby source coverage.
Original source
Read on NewsBTCRelated market context

XRP Price Prediction: XRP Faces Critical Resistance Near $1.17 Despite Ripple Securing Landmark EU License
While the company secured a full MiCA license that expands its operations across the European Economic Area, market indicators sug...

Bitcoin (BTC) Price Prediction: BTC Holds $63K Support—Can Rising Active Addresses Offset Bearish Technical Signals?
Although the BTC price has remained near a key support zone, recent chart signals and Strategy’s sale of a portion of its Bitcoin...

Sam Altman ChatGPT AI Predicts Insane Bitcoin Price by 2026
Sam Altman ChatGPT AI just circled November on the calendar and put a number next to Bitcoin Price Prediction. The model predicts...

Ethereum’s treasury boom now has one company nearing 5% of supply
Ethereum treasury company BitMine said it now holds 5,742,237 ETH, or 4.8% of Ethereum's (ETH) 120.7 million token supply, putting...

Iran shoots down US MQ-9 Reaper drone, Bitcoin drops below $73K as nearly $1B in crypto liquidations follow
Geopolitical tensions highlight crypto market volatility, underscoring the interconnectedness with traditional finance and potenti...

Elon Musk Grok AI Predicts Incredible XRP Price Target by End of 2026
Elon Musk Grok AI just published what might be the most partnership-heavy XRP price prediction in this entire series. The model pr...