Bitcoin Price Faces Big Test – Resistance Could Decide Next Move
Bitcoin price is moving higher above $116,500. BTC is now facing hurdles and might gain bullish momentum if it clears the $117,250 resistance zone. Bitcoin started a fresh increase above the $116,200 zone. The price is t...
Archive context
Older archive item. Useful for background and entity history, but not a fresh market-moving signal.

Bitcoin price is moving higher above $116,500. BTC is now facing hurdles and might gain bullish momentum if it clears the $117,250 resistance zone.
- Bitcoin started a fresh increase above the $116,200 zone.
- The price is trading below $116,200 and the 100 hourly Simple moving average.
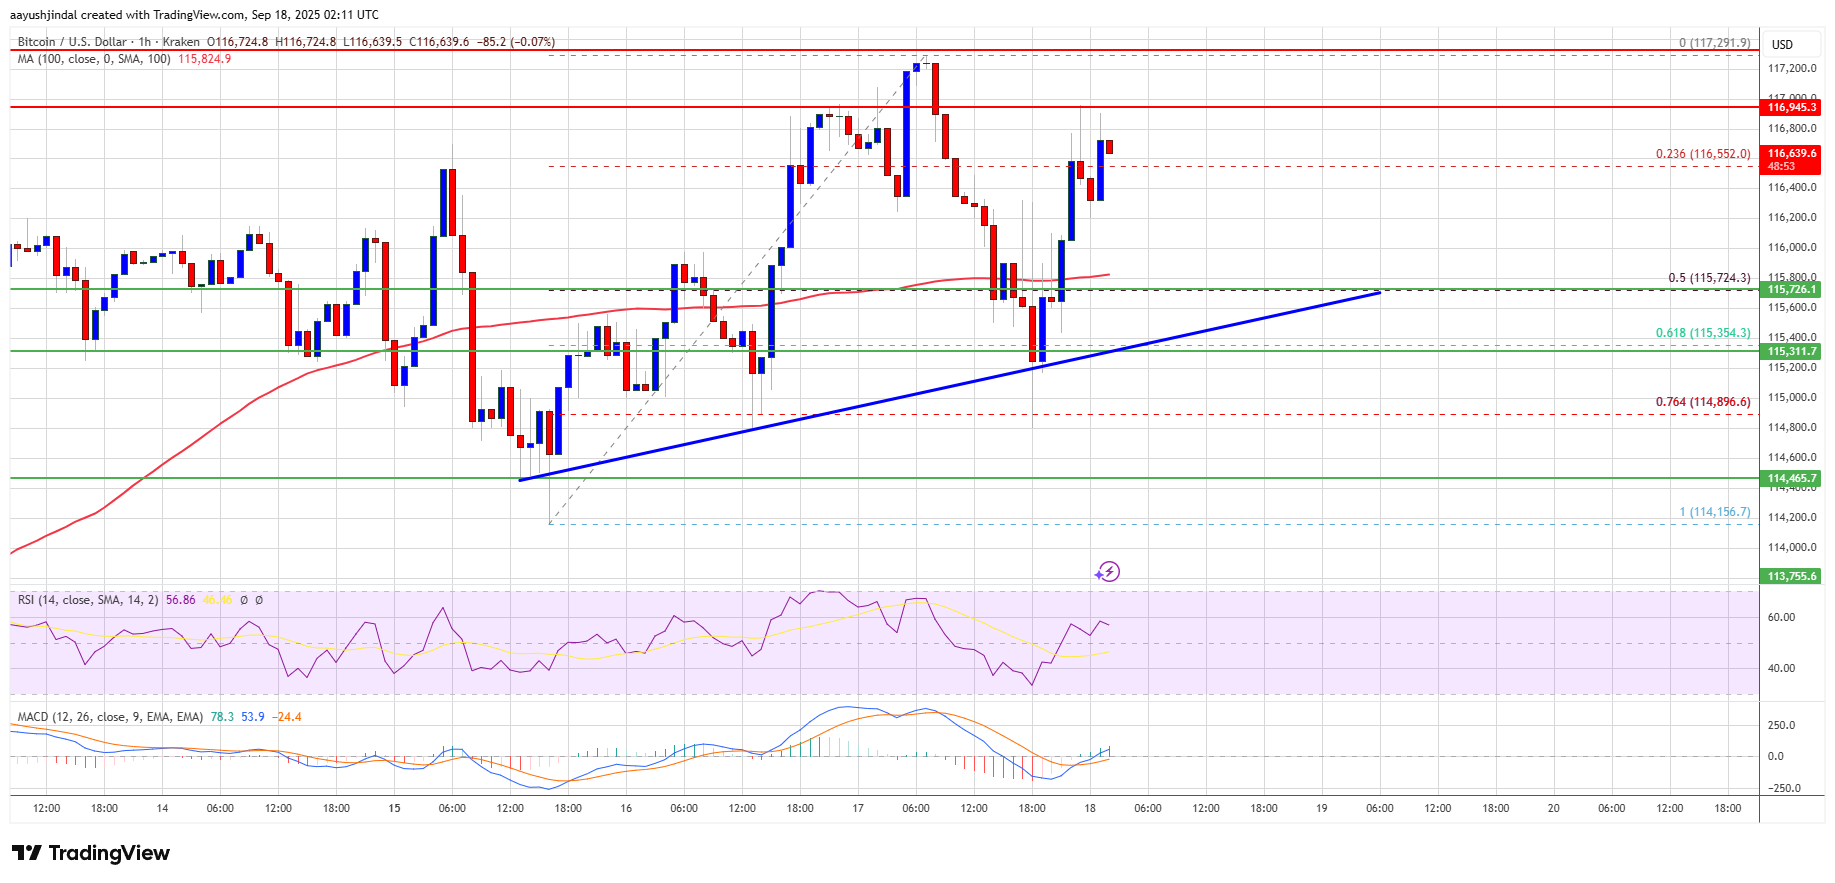
- There is a key bullish trend line forming with support at $115,500 on the hourly chart of the BTC/USD pair (data feed from Kraken).
- The pair might start another increase if it clears the $117,250 zone.
Bitcoin price started a fresh upward wave above the $115,500 zone. BTC managed to climb above the $116,000 and $116,200 resistance levels.
The bulls were able to push the price above $117,000. The price traded as high as $117,291 and recently started a downside correction. There was a move below the $116,800 level. The price dipped below the 50% Fib retracement level of the recent move from the $114,157 swing low to the $117,291 high.
However, the bulls were active near $115,000 and the 61.8% Fib retracement level of the recent move from the $114,157 swing low to the $117,291 high. Bitcoin is now trading above $116,200 and the 100 hourly Simple moving average. Besides, there is a key bullish trend line forming with support at $115,500 on the hourly chart of the BTC/USD pair.
Immediate resistance on the upside is near the $116,950 level. The first key resistance is near the $117,250 level. The next resistance could be $117,800. A close above the $117,800 resistance might send the price further higher. In the stated case, the price could rise and test the $118,500 resistance level. Any more gains might send the price toward the $118,800 level. The next barrier for the bulls could be $119,250.
Another Drop In BTC?If Bitcoin fails to rise above the $117,250 resistance zone, it could start a fresh decline. Immediate support is near the $116,200 level. The first major support is near the $115,500 level or the trend line.
The next support is now near the $115,000 zone. Any more losses might send the price toward the $114,500 support in the near term. The main support sits at $112,500, below which BTC might decline heavily.
Technical indicators:
Hourly MACD – The MACD is now gaining pace in the bullish zone.
Hourly RSI (Relative Strength Index) – The RSI for BTC/USD is now above the 50 level.
Major Support Levels – $115,500, followed by $115,000.
Major Resistance Levels – $116,950 and $117,250.
Why this matters
This bitcoin story adds another data point to the current market tape and is useful when read alongside nearby source coverage.
Original source
Read on NewsBTCRelated market context

XRP Price Prediction: XRP Faces Critical Resistance Near $1.17 Despite Ripple Securing Landmark EU License
While the company secured a full MiCA license that expands its operations across the European Economic Area, market indicators sug...

Sam Altman ChatGPT AI Predicts Insane Bitcoin Price by 2026
Sam Altman ChatGPT AI just circled November on the calendar and put a number next to Bitcoin Price Prediction. The model predicts...

Elon Musk Grok AI Predicts Incredible XRP Price Target by End of 2026
Elon Musk Grok AI just published what might be the most partnership-heavy XRP price prediction in this entire series. The model pr...

Iran shoots down US MQ-9 Reaper drone, Bitcoin drops below $73K as nearly $1B in crypto liquidations follow
Geopolitical tensions highlight crypto market volatility, underscoring the interconnectedness with traditional finance and potenti...
Solana’s $8.7B RWA surge shows tokenized assets are finally starting to move
Solana’s real-world asset transfer volume more than doubled over the past month, giving the network a stronger signal that tokeniz...

Bitcoin price rebounds to $63K as leverage returns creating short term volatility risk
Bitcoin's rebound has cleared the first test: price recovered. The harder one starts now: proving buyers remain after the squeeze....