Bitcoin Price Faces Crucial Test, Indicators Suggest Many Roadblocks To Recovery
Bitcoin price dived toward the $38,500 support zone. BTC is attempting a recovery wave and might struggle to climb above the $40,500 resistance. Bitcoin price extended its decline and tested the $38,500 support zone. The...
Archive context
Older archive item. Useful for background and entity history, but not a fresh market-moving signal.

Bitcoin price dived toward the $38,500 support zone. BTC is attempting a recovery wave and might struggle to climb above the $40,500 resistance.
- Bitcoin price extended its decline and tested the $38,500 support zone.
- The price is trading below $40,000 and the 100 hourly Simple moving average.
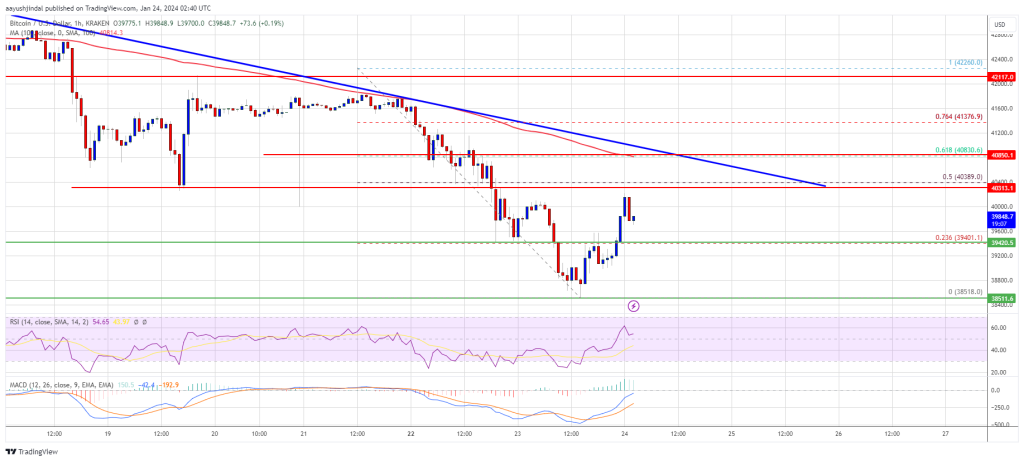
- There is a key bearish trend line forming with resistance near $40,450 on the hourly chart of the BTC/USD pair (data feed from Kraken).
- The pair might struggle to recover above the $40,000 and $40,500 resistance levels.
Bitcoin price remained in a bearish zone below the $40,000 support zone. BTC extended its decline and traded below the $49,200 level. Finally, it tested the $38,500 support zone, as discussed in yesterday’s post.
A new weekly low was formed near $38,518 and the price is now correcting losses. It is slowly recovering above the $39,000 level. It cleared the 23.6% Fib retracement level of the downward move from the $42,260 swing high to the $38,518 low.
Bitcoin is now trading below $40,000 and the 100 hourly Simple moving average. Immediate resistance is near the $40,000 level. The first major resistance is near the $40,350 level or the 50% Fib retracement level of the downward move from the $42,260 swing high to the $38,518 low.
Source: BTCUSD on TradingView.com
There is also a key bearish trend line forming with resistance near $40,450 on the hourly chart of the BTC/USD pair. A clear move above the $40,450 resistance could send the price toward the $40,850 resistance. The next resistance is now forming near the $41,250 level. A close above the $41,250 level could push the price further higher. The next major resistance sits at $42,000.
Another Decline In BTC?If Bitcoin fails to rise above the $40,450 resistance zone, it could start another decline. Immediate support on the downside is near the $39,400 level.
The next major support is $39,000. If there is a close below $39,000, the price could gain bearish momentum. In the stated case, the price could revisit the $38,500 support in the near term.
Technical indicators:
Hourly MACD – The MACD is now losing pace in the bearish zone.
Hourly RSI (Relative Strength Index) – The RSI for BTC/USD is now above the 50 level.
Major Support Levels – $39,400, followed by $38,500.
Major Resistance Levels – $40,350, $40,450, and $40,850.
Why this matters
This bitcoin story adds another data point to the current market tape and is useful when read alongside nearby source coverage.
Original source
Read on NewsBTCRelated market context

Hedge Funds Are Most Bearish onYen Since 2007: Could Japan Rotation Send XRP to $2.00?
XRP News: XRP is trading around $1.07, down roughly 3% over the past 24 hours, but still carrying a 6–7% weekly gain that keeps th...

Ethereum Price Stabilizes as Tether Burns $2.5 Billion USDT Stablecoins
Ethereum is slipping by more than 2% as massive $2.5 billion USDT burn on Ethereum dragged its price prediction down. Although ETH...

Cardano Price Prediction: ADA Pulls Back to $0.17 After a Strong Weekly Rally as Bulls Watch $0.20 and $0.22 Reclaim
Cardano price is trading near $0.17 after a weaker 24-hour session, according to Brave New Coin data. ADA is down around 4.84% on...

US-Iran Strikes and $7.7B Stablecoin Exit Put Bitcoin at $62,870
In the latest Bitcoin news, Bitcoin saw BTC price drop to $62,870 on Wednesday after stalling at the $64,000 resistance zone, with...

Ethereum’s treasury boom now has one company nearing 5% of supply
Ethereum treasury company BitMine said it now holds 5,742,237 ETH, or 4.8% of Ethereum's (ETH) 120.7 million token supply, putting...

XRP Reclaims A Key Support Zone As Traders Watch Open Interest Build
XRP has moved back into a zone traders are watching closely, with the $0.50 area acting as the line that decides whether the lates...