Bitcoin Price Keeps Climbing – Are We Hours Away From a Major Breakout?
Bitcoin price is moving higher above $116,650. BTC is now facing hurdles and might extend gains if it clears the $118,000 resistance zone. Bitcoin started a fresh increase above the $116,500 zone. The price is trading be...
Archive context
Older archive item. Useful for background and entity history, but not a fresh market-moving signal.

Bitcoin price is moving higher above $116,650. BTC is now facing hurdles and might extend gains if it clears the $118,000 resistance zone.
- Bitcoin started a fresh increase above the $116,500 zone.
- The price is trading below $116,500 and the 100 hourly Simple moving average.
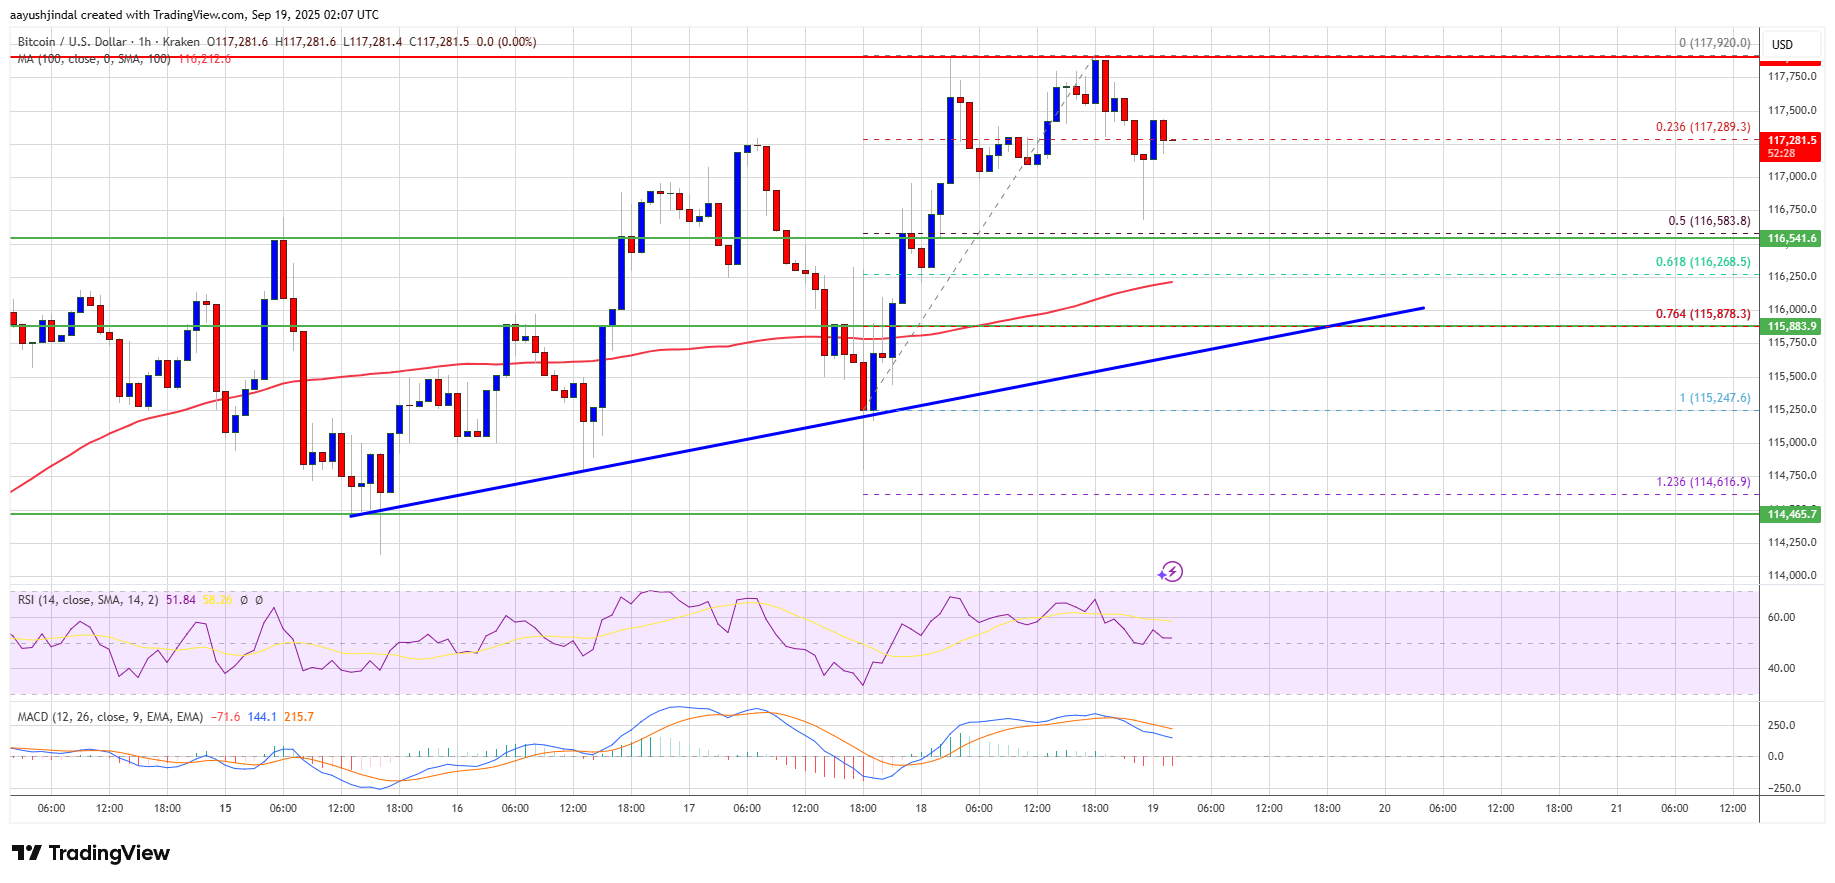
- There is a key bullish trend line forming with support at $115,800 on the hourly chart of the BTC/USD pair (data feed from Kraken).
- The pair might start another increase if it clears the $117,850 zone.
Bitcoin price started a fresh upward wave above the $116,000 zone. BTC managed to climb above the $116,200 and $116,500 resistance levels.
The bulls were able to push the price above $117,500. The price traded as high as $117,920 and recently started a downside correction. There was a move below the $117,200 level. The price dipped and tested the 50% Fib retracement level of the upward move from the $115,247 swing low to the $117,920 high.
However, the bulls were active near $116,750. Bitcoin is now trading above $116,500 and the 100 hourly Simple moving average. Besides, there is a key bullish trend line forming with support at $115,800 on the hourly chart of the BTC/USD pair.
Immediate resistance on the upside is near the $117,500 level. The first key resistance is near the $117,850 level. The next resistance could be $118,000. A close above the $118,000 resistance might send the price further higher. In the stated case, the price could rise and test the $118,500 resistance level. Any more gains might send the price toward the $118,800 level. The next barrier for the bulls could be $119,250.
Another Drop In BTC?If Bitcoin fails to rise above the $117,850 resistance zone, it could start a fresh decline. Immediate support is near the $116,550 level. The first major support is near the $115,800 level or the trend line and the 76.4% Fib retracement level of the upward move from the $115,247 swing low to the $117,920 high.
The next support is now near the $115,250 zone. Any more losses might send the price toward the $114,500 support in the near term. The main support sits at $112,500, below which BTC might decline heavily.
Technical indicators:
Hourly MACD – The MACD is now losing pace in the bullish zone.
Hourly RSI (Relative Strength Index) – The RSI for BTC/USD is now above the 50 level.
Major Support Levels – $116,550, followed by $115,800.
Major Resistance Levels – $117,850 and $118,000.
Why this matters
This bitcoin story adds another data point to the current market tape and is useful when read alongside nearby source coverage.
Original source
Read on NewsBTCRelated market context

XRP Price Prediction: XRP Faces Critical Resistance Near $1.17 Despite Ripple Securing Landmark EU License
While the company secured a full MiCA license that expands its operations across the European Economic Area, market indicators sug...

Sam Altman ChatGPT AI Predicts Insane Bitcoin Price by 2026
Sam Altman ChatGPT AI just circled November on the calendar and put a number next to Bitcoin Price Prediction. The model predicts...

Ethereum Price Stabilizes as Tether Burns $2.5 Billion USDT Stablecoins
Ethereum is slipping by more than 2% as massive $2.5 billion USDT burn on Ethereum dragged its price prediction down. Although ETH...

US-Iran Strikes and $7.7B Stablecoin Exit Put Bitcoin at $62,870
In the latest Bitcoin news, Bitcoin saw BTC price drop to $62,870 on Wednesday after stalling at the $64,000 resistance zone, with...

Elon Musk Grok AI Predicts Incredible XRP Price Target by End of 2026
Elon Musk Grok AI just published what might be the most partnership-heavy XRP price prediction in this entire series. The model pr...

Bitcoin price rebounds to $63K as leverage returns creating short term volatility risk
Bitcoin's rebound has cleared the first test: price recovered. The harder one starts now: proving buyers remain after the squeeze....