Bitcoin Price Moons To $57K As The Bulls Aim For $60K
Bitcoin price is up over 10% and surging toward $58,000. BTC is signaling a strong upward trend and might surge toward the $60,000 resistance. Bitcoin price is gaining pace above the $55,000 resistance zone. The price is...
Archive context
Older archive item. Useful for background and entity history, but not a fresh market-moving signal.

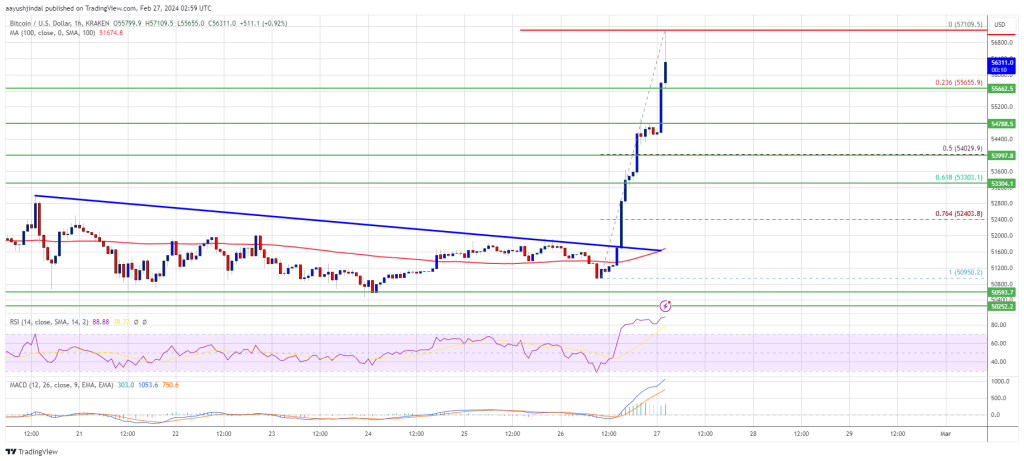
Bitcoin price is up over 10% and surging toward $58,000. BTC is signaling a strong upward trend and might surge toward the $60,000 resistance.
- Bitcoin price is gaining pace above the $55,000 resistance zone.
- The price is trading above $55,000 and the 100 hourly Simple moving average.
- There was a break above a major bearish trend line with resistance at $51,600 on the hourly chart of the BTC/USD pair (data feed from Kraken).
- The pair could extend its current rally toward the $60,000 resistance zone.
Bitcoin price remained well-bid above the $50,500 support zone. A support base was formed above the $51,500 level and the price started a fresh rally. BTC gained bullish momentum after it broke the $51,600 and $52,000 resistance levels.
There was a break above a major bearish trend line with resistance at $51,600 on the hourly chart of the BTC/USD pair. The pair surged over 10% and broke many hurdles near the $55,000 level. A new multi-week high is formed near $57,109 and the price is now retreating.
Bitcoin is still trading above $55,000 and the 100 hourly Simple moving average. It is also above the 23.6% Fib retracement level of the recent rally from the $50,950 swing low to the $57,109 high.
Source: BTCUSD on TradingView.com
Immediate resistance is near the $56,800 level. The next key resistance could be $57,000, above which the price could rise toward the $58,000 resistance zone. If the bulls remain in action, the price could even surpass $58,000 and test $58,800. The main hurdle for them is visible near the $60,000 zone.
Are Dips Limited In BTC?If Bitcoin fails to rise above the $57,000 resistance zone, it could start a downside correction. Immediate support on the downside is near the $56,000 level.
The first major support is $55,600. If there is a close below $55,600, the price could start a decent pullback toward the 50% Fib retracement level of the recent rally from the $50,950 swing low to the $57,109 high. Any more losses might send the price toward the $53,200 support zone.
Technical indicators:
Hourly MACD – The MACD is now gaining pace in the bullish zone.
Hourly RSI (Relative Strength Index) – The RSI for BTC/USD is now above the 50 level.
Major Support Levels – $56,000, followed by $55,600.
Major Resistance Levels – $57,000, $58,000, and $60,000.
Why this matters
This bitcoin story adds another data point to the current market tape and is useful when read alongside nearby source coverage.
Original source
Read on NewsBTCRelated market context

Cardano Price Prediction: ADA Pulls Back to $0.17 After a Strong Weekly Rally as Bulls Watch $0.20 and $0.22 Reclaim
Cardano price is trading near $0.17 after a weaker 24-hour session, according to Brave New Coin data. ADA is down around 4.84% on...

Hedge Funds Are Most Bearish onYen Since 2007: Could Japan Rotation Send XRP to $2.00?
XRP News: XRP is trading around $1.07, down roughly 3% over the past 24 hours, but still carrying a 6–7% weekly gain that keeps th...

Bitcoin’s rally has 4 weeks to get its Washington CLARITY catalyst before the clock runs out
The US Senate returns to Washington next week with 20 working days to decide whether the CLARITY Act, which is the most advanced c...

XRP Reclaims A Key Support Zone As Traders Watch Open Interest Build
XRP has moved back into a zone traders are watching closely, with the $0.50 area acting as the line that decides whether the lates...

Bitcoin Slips to $62,000, Paring Rebound as CryptoQuant Sees Room Higher
Bitcoin Magazine Bitcoin Slips to $62,000, Paring Rebound as CryptoQuant Sees Room Higher Bitcoin traded near $62,000 today, surre...

Bitcoin’s ETF comeback is relying on a $79B futures market betting the rebound holds
Bitcoin’s rebound above $63,000 is being helped by renewed ETF inflows, but the harder test will now be whether the liquidity bene...