Bitcoin Price Settles Below $60K, Is This A Critical Bearish Sign?
Bitcoin price extended losses and settled below $60,000. BTC is now consolidating losses near $58,000 and remains at risk of more downsides in the near term. Bitcoin extended losses and traded below the $60,000 zone. The...
Archive context
Older archive item. Useful for background and entity history, but not a fresh market-moving signal.

Bitcoin price extended losses and settled below $60,000. BTC is now consolidating losses near $58,000 and remains at risk of more downsides in the near term.
- Bitcoin extended losses and traded below the $60,000 zone.
- The price is trading below $59,000 and the 100 hourly Simple moving average.
- There is a major bearish trend line forming with resistance at $58,000 on the hourly chart of the BTC/USD pair (data feed from Kraken).
- The pair could continue to move down since there is a daily close below the $60,000 zone.
Bitcoin price remained in a bearish zone and traded below the $60,500 support level. BTC even settled below the $60,000 level to enter a short-term bearish zone.
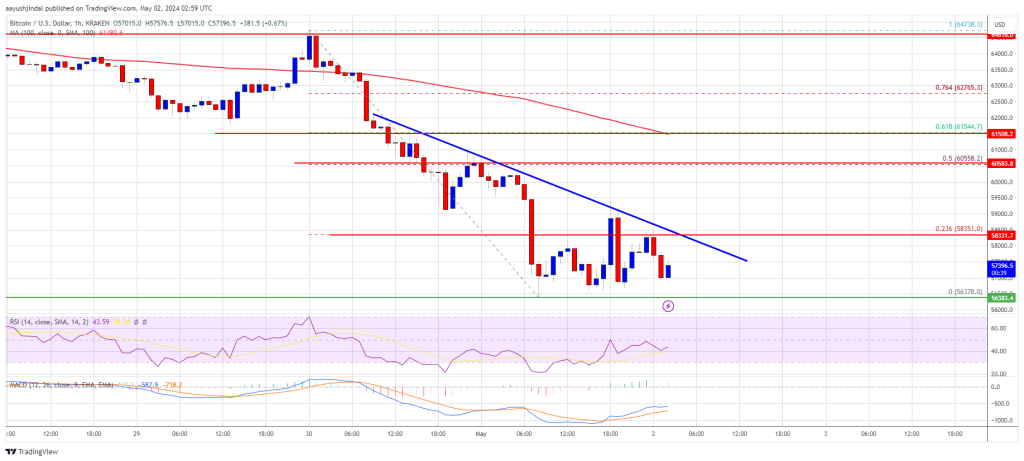
There was a drop below the $58,000 level. A low was formed at $56,378 and the price is now consolidating losses. There was a minor increase toward the $58,000 level and the 23.6% Fib retracement level of the downward move from the $64,740 swing high to the $56,378 low.
Bitcoin is now trading below $58,500 and the 100 hourly Simple moving average. Immediate resistance is near the $58,000 level. There is also a major bearish trend line forming with resistance at $58,000 on the hourly chart of the BTC/USD pair.
The first major resistance could be $59,200. The next key resistance could be $60,500 or the 50% Fib retracement level of the downward move from the $64,740 swing high to the $56,378 low.
Source: BTCUSD on TradingView.com
A clear move above the $60,500 resistance might send the price higher. The next resistance now sits at $61,500. If there is a clear move above the $61,500 resistance zone, the price could continue to move up. In the stated case, the price could rise toward $63,500.
More Losses In BTC?If Bitcoin fails to rise above the $58,500 resistance zone, it could continue to move down. Immediate support on the downside is near the $57,000 level.
The first major support is $56,500. If there is a close below $56,500, the price could start to drop toward $55,000. Any more losses might send the price toward the $53,500 support zone in the near term.
Technical indicators:
Hourly MACD – The MACD is now gaining pace in the bearish zone.
Hourly RSI (Relative Strength Index) – The RSI for BTC/USD is now below the 50 level.
Major Support Levels – $57,000, followed by $56,500.
Major Resistance Levels – $58,500, $60,500, and $61,500.
Why this matters
This bitcoin story adds another data point to the current market tape and is useful when read alongside nearby source coverage.
Original source
Read on NewsBTCRelated market context

XRP Price Prediction: XRP Faces Critical Resistance Near $1.17 Despite Ripple Securing Landmark EU License
While the company secured a full MiCA license that expands its operations across the European Economic Area, market indicators sug...

Sam Altman ChatGPT AI Predicts Insane Bitcoin Price by 2026
Sam Altman ChatGPT AI just circled November on the calendar and put a number next to Bitcoin Price Prediction. The model predicts...

Ethereum is losing ownership of crypto payments as Base moves $565B in stablecoins
Stablecoin activity is becoming a contest over which blockchains move the most tokenized dollars. Visa Onchain Analytics showed th...

Iran shoots down US MQ-9 Reaper drone, Bitcoin drops below $73K as nearly $1B in crypto liquidations follow
Geopolitical tensions highlight crypto market volatility, underscoring the interconnectedness with traditional finance and potenti...

Premier League clubs’ pre-tax losses surge to nearly £1B as crypto sponsorship scrutiny intensifies
The financial instability of Premier League clubs, exacerbated by crypto sponsorship scrutiny, could reshape sponsorship dynamics...

Solana’s $8.7B RWA surge shows tokenized assets are finally starting to move
Solana’s real-world asset transfer volume more than doubled over the past month, giving the network a stronger signal that tokeniz...