How High Can Bitcoin Go Before A Top? Analyst Chimes In
An analyst has explained how the Bitcoin rally could still have room to run before hitting a top based on the data of this indicator. Bitcoin Macro Oscillator Isn’t At Historical Top Zone Yet In a new post on X, analyst...
Archive context
Older archive item. Useful for background and entity history, but not a fresh market-moving signal.

An analyst has explained how the Bitcoin rally could still have room to run before hitting a top based on the data of this indicator.
Bitcoin Macro Oscillator Isn’t At Historical Top Zone YetIn a new post on X, analyst Willy Woo has discussed the recent trend developing in the Bitcoin Macro Oscillator (BMO). This indicator combines four different metrics to provide an oscillating value around the zero mark.
The indicators in question are the market Value to Realized Value (MVRV) ratio, Volume-Weighted Average Price (VWAP) ratio, Cumulative Value-Days Destroyed (CVDD) ratio, and Sharpe ratio.
The chart below shows how the oscillator based on these metrics has fluctuated in value over the past few Bitcoin cycles.
From the graph, it’s visible that tops in the cryptocurrency’s price have historically coincided with the metric reaching relatively high levels. More particularly, the 2013 and 2021 tops occurred when the indicator breached the 1.8 level, while the 2017 peak occurred when the oscillator hit 2.4.
So far, in the current rally, the oscillator has achieved a peak value of 1.2. This high coincided with the asset’s all-time high (ATH) price, which continues to be the top of the run thus far.
When considering the historical precedent, though, this value doesn’t seem to be high enough for the top to have been cyclical. As the coin’s price has consolidated since this high, the oscillator has cooled off, now hitting just 0.69.
Thus, the asset has gained more distance from the zone where tops have occurred in the past. “This 2.5 months of consolidation under bullish demand has been very good for Bitcoin; it means the price has more room to run before topping out,” notes Woo. The analyst suggests that BTC could now have 2 to 3 levels of the BMO to climb before reaching the macro top.
Woo has also pointed out a potential positive sign brewing for Bitcoin regarding its net capital flows. Below is a chart showing this metric’s trend over the last few years.
As displayed in the graph, net capital flows into Bitcoin were quite high during the surge toward the price ATH, but money stopped flowing in as the asset fell into sideways movement.
During May, though, the net flows have finally reversed the trend, as they have been on the rise once more. This fresh demand can naturally be bullish for the cryptocurrency’s value.
BTC PriceBitcoin surged above the $70,500 level earlier, but the coin has since slumped back down, trading around $67,800.
Why this matters
This bitcoin story adds another data point to the current market tape and is useful when read alongside nearby source coverage.
Original source
Read on NewsBTCRelated market context
Solana’s $8.7B RWA surge shows tokenized assets are finally starting to move
Solana’s real-world asset transfer volume more than doubled over the past month, giving the network a stronger signal that tokeniz...

XRP Price Prediction: XRP Faces Critical Resistance Near $1.17 Despite Ripple Securing Landmark EU License
While the company secured a full MiCA license that expands its operations across the European Economic Area, market indicators sug...

Vanguard Warms to Crypto With Search for Digital Assets Chief
Bitcoin Magazine Vanguard Warms to Crypto With Search for Digital Assets Chief Vanguard, one of the world’s largest asset managers...

SpaceX Nasdaq-100 Entry Brings Bitcoin Exposure to Passive Index Investors
Bitcoin Magazine SpaceX Nasdaq-100 Entry Brings Bitcoin Exposure to Passive Index Investors Today (July 7, 2026) SpaceX formally j...

Elon Musk Grok AI Predicts Incredible XRP Price Target by End of 2026
Elon Musk Grok AI just published what might be the most partnership-heavy XRP price prediction in this entire series. The model pr...
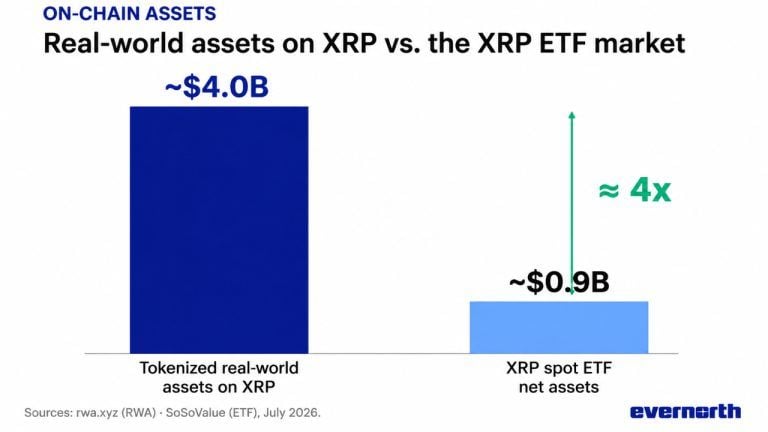
XRP Sees Triple Adoption Boost as Tokenized Assets Reach $4 Billion, ETF Demand Stays Strong
XRP is showing growth across multiple adoption metrics, with approximately $4 billion in tokenized real-world assets, continued sp...