Why “Overbought” Bitcoin Could Trigger A 107% Rally
Bitcoin price had previously been showing extreme strength leading up until the debut of the first spot ETFs. That strength has since subsided, leading to a 20% correction in BTCUSD. A popular technical indicator that me...
Archive context
Older archive item. Useful for background and entity history, but not a fresh market-moving signal.

Bitcoin price had previously been showing extreme strength leading up until the debut of the first spot ETFs. That strength has since subsided, leading to a 20% correction in BTCUSD.
A popular technical indicator that measures momentum, however, could point to powerful continuation to the upside, but only if a certain level is breached. Keep reading to learn more about the Relative Strength Index and how the top cryptocurrency behaves once the market reaches an “overbought” level.
Bitcoin Approaches “Overbought” And Why This Isn’t A Bad ThingThe Relative Strength Index is a momentum-measuring tool that signals when a market is “overbought” or “oversold”. When a financial asset reaches such conditions, it often means the trend is about to change.
In Bitcoin and other cryptocurrencies, the weekly RSI is often a signal that the asset is moving into its most powerful phase. For example, Bitcoin made it above a reading of 70 in October 2023, and only weeks later saw an over 60% rally to local 2024 highs.
Now 1W BTCUSD charts are showing an RSI reading of just below 70, pointing to a possible close back above the overbought level. If bulls can keep the top cryptocurrency by market cap above $43,650, the weekly RSI should close above the threshold.
BTCUSD Historical 1W Relative Strength DataHistorical data could possibly shed some light on what might happen if the weekly Relative Strength Index gets the close above 70 as anticipated.
Over the last ten years, Bitcoin saw a 1W RSI close above 70 a total of 13 times. This happened 8 times in 2016 and 2017, twice in 2019, and once each in 2020 and 2021. One additional instance occurred in 2023.
Of the 13 times, the average gain after the RSI closed above 70 to the peak of the movement was 107%. The largest rally was in 2020, bringing over 400% returns. The smallest rally was in 2016 and saw only a 20% gain.
After removing the largest and smallest outliers, the average drops down to around 61%. This could mean that Bitcoin could produce on average a move between 61 and 107%.
A 61% gain takes BTCUSD back to just under $68,000 and shy of a new all-time high, while a 107% move sets a new record closer to $90,000 per coin. The cryptocurrency is also potentially working on a bull flag pattern, with a target of around $77,000.
Why this matters
This bitcoin story adds another data point to the current market tape and is useful when read alongside nearby source coverage.
Original source
Read on NewsBTCRelated market context

Cardano Price Prediction: ADA Pulls Back to $0.17 After a Strong Weekly Rally as Bulls Watch $0.20 and $0.22 Reclaim
Cardano price is trading near $0.17 after a weaker 24-hour session, according to Brave New Coin data. ADA is down around 4.84% on...
XRP cleaned out leverage, now ETF demand has to prove itself
XRP’s late-June washout removed a major source of market instability: excess leverage that could have turned another sharp move in...
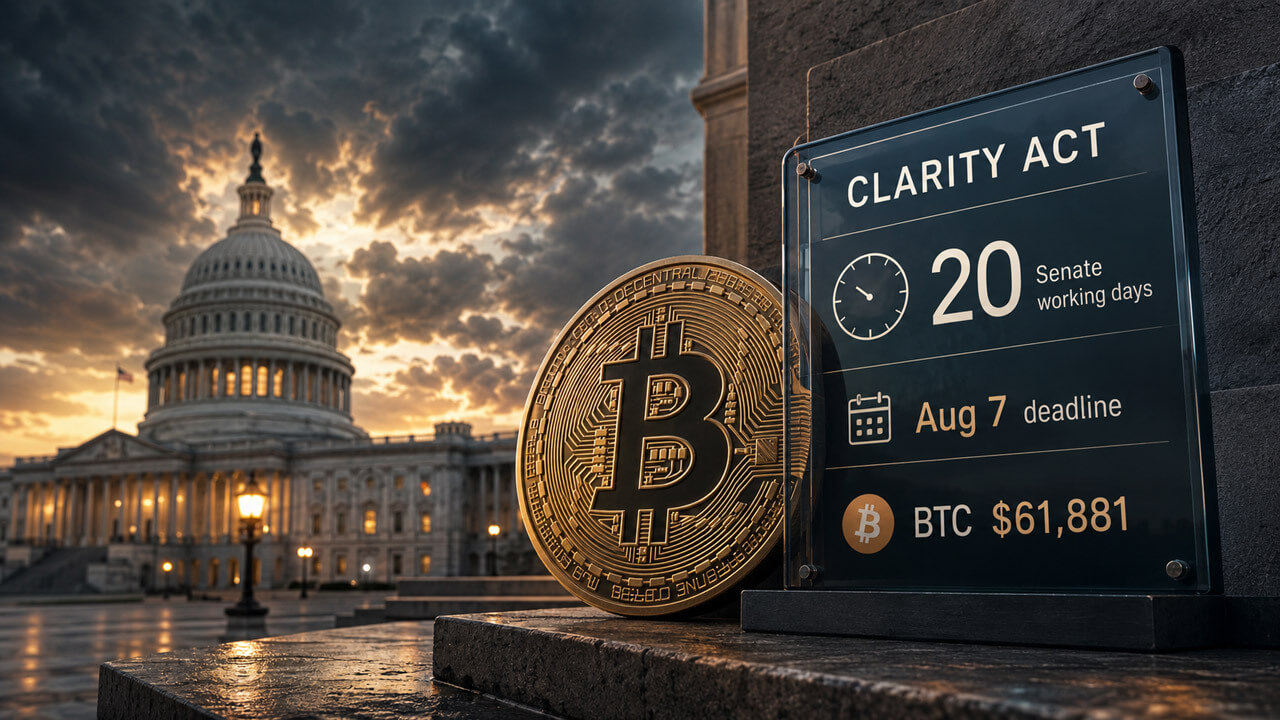
Bitcoin’s rally has 4 weeks to get its Washington CLARITY catalyst before the clock runs out
The US Senate returns to Washington next week with 20 working days to decide whether the CLARITY Act, which is the most advanced c...
Solana’s $8.7B RWA surge shows tokenized assets are finally starting to move
Solana’s real-world asset transfer volume more than doubled over the past month, giving the network a stronger signal that tokeniz...
Bitcoin Slips to $62,000, Paring Rebound as CryptoQuant Sees Room Higher
Bitcoin Magazine Bitcoin Slips to $62,000, Paring Rebound as CryptoQuant Sees Room Higher Bitcoin traded near $62,000 today, surre...
Bitcoin ETFs draw $500M but weak demand leaves rebound exposed
US spot Bitcoin exchange-traded funds drew nearly $500 million across the last two trading sessions, giving traders their first cl...