Ethereum Price Dips Below $2,500: Investors Eye Key Support Levels
Ethereum price started a fresh decline below the $2,550 zone. ETH is now showing a few bearish signs below the $2,500 pivot level. Ethereum started a fresh decline below the $2,550 level. The price is trading above $2,50...
Archive context
Older archive item. Useful for background and entity history, but not a fresh market-moving signal.

Ethereum price started a fresh decline below the $2,550 zone. ETH is now showing a few bearish signs below the $2,500 pivot level.
- Ethereum started a fresh decline below the $2,550 level.
- The price is trading above $2,500 and the 100-hourly Simple Moving Average.
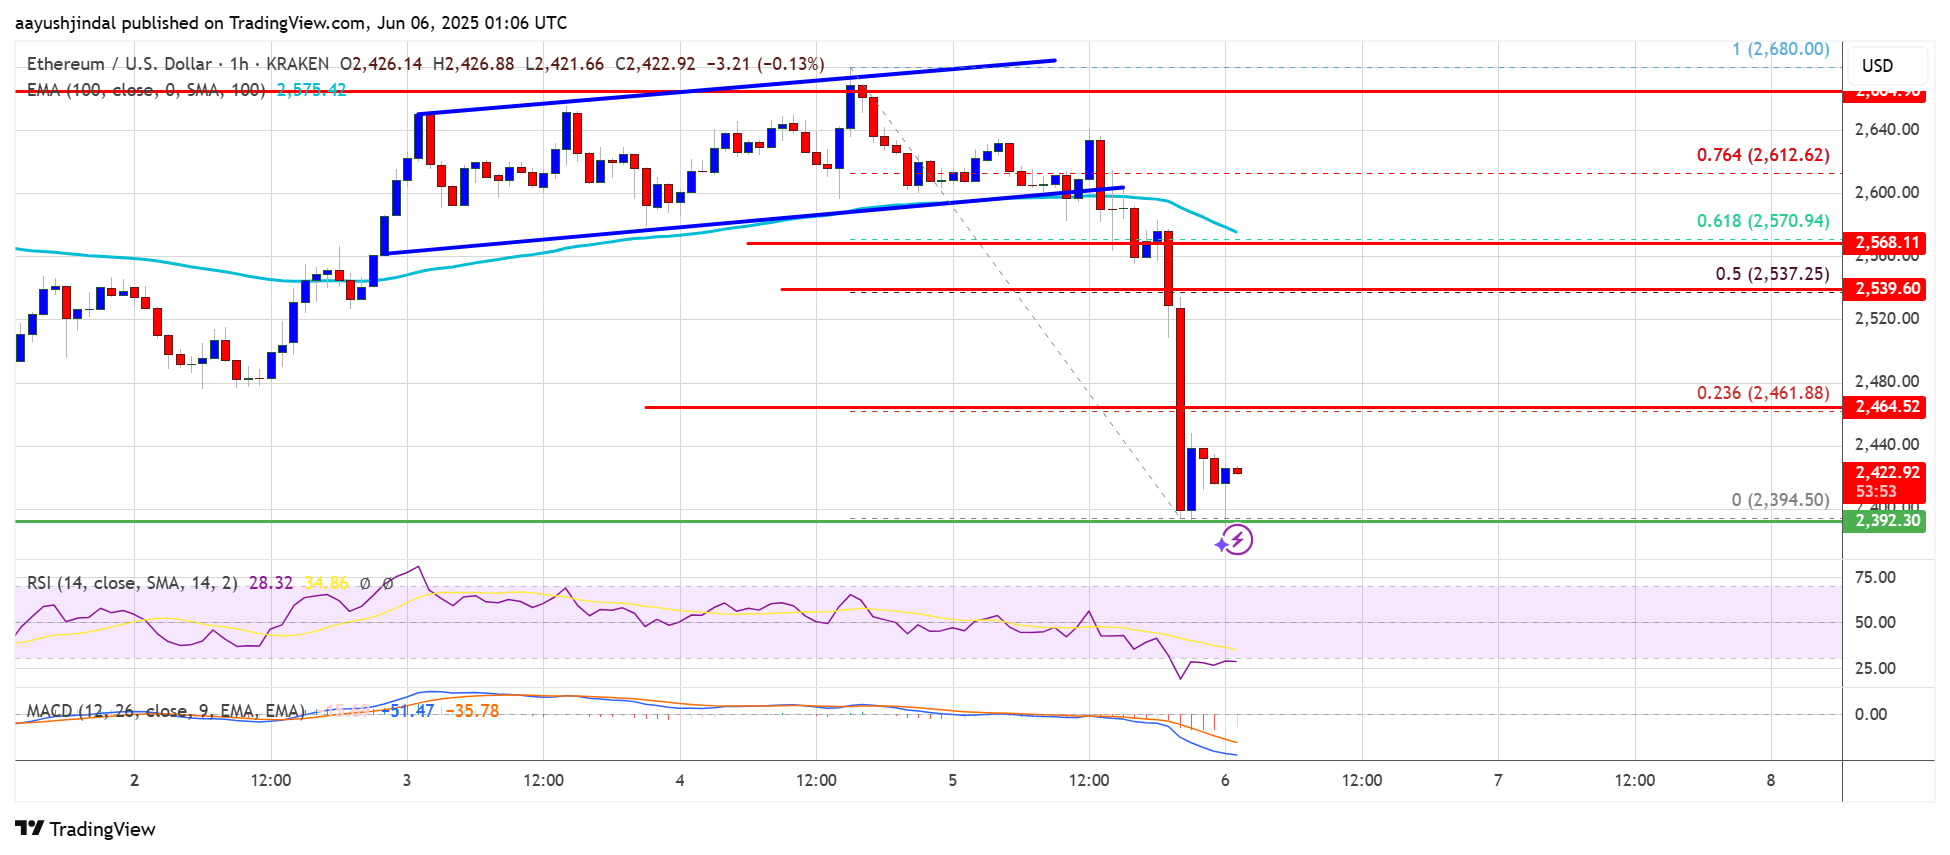
- There was a break below a key rising channel with support at $2,610 on the hourly chart of ETH/USD (data feed via Kraken).
- The pair could extend losses if it trades below the $2,400 support zone in the near term.
Ethereum price started a fresh decline after it failed to surpass $2,650, like Bitcoin. ETH price declined below the $2,565 and $2,550 support levels.
Besides, there was a break below a key rising channel with support at $2,610 on the hourly chart of ETH/USD. The pair even dipped below the $2,500 support level. A low was formed at $2,394 and the price is now consolidating losses.
Ethereum price is now trading below $2,500 and the 100-hourly Simple Moving Average. On the upside, the price could face resistance near the $2,460 level. It is close to the 23.6% Fib retracement level of the downward move from the $2,680 swing high to the $2,394 low.
The next key resistance is near the $2,500 level. The first major resistance is near the $2,540 level. It is close to the 50% Fib retracement level of the downward move from the $2,680 swing high to the $2,394 low. A clear move above the $2,540 resistance might send the price toward the $2,600 resistance.
An upside break above the $2,600 resistance might call for more gains in the coming sessions. In the stated case, Ether could rise toward the $2,650 resistance zone or even $2,720 in the near term.
More Losses In ETH?If Ethereum fails to clear the $2,500 resistance, it could start a fresh decline. Initial support on the downside is near the $2,400 level. The first major support sits near the $2,380 zone.
A clear move below the $2,380 support might push the price toward the $2,350 support. Any more losses might send the price toward the $2,320 support level in the near term. The next key support sits at $2,250.
Technical Indicators
Hourly MACD – The MACD for ETH/USD is gaining momentum in the bearish zone.
Hourly RSI – The RSI for ETH/USD is now below the 50 zone.
Major Support Level – $2,320
Major Resistance Level – $2,500
Why this matters
This ethereum story adds another data point to the current market tape and is useful when read alongside nearby source coverage.
Original source
Read on NewsBTCRelated market context

Solana Price Prediction: SOL Holds Near $81 as Breakout Setup Points to $87, but Whale Flows Keep Risk Active
Solana price is back in focus after a sharp recovery pushed SOL towards the $81 area. The move has improved short-term momentum, e...

Bitcoin whales send 49,000 BTC to exchanges as $60K rebound shows signs of weakness
Bitcoin’s recovery above $60,000 is facing a fresh test from exchange-flow and derivatives data after large holders moved one of t...

XRP Price Prediction: SuperTrend Buy Signal Meets Shrinking Supply as $1.24 Breakout Comes Into Focus
After a fresh SuperTrend buy signal appeared on the 4-hour chart, analysts are watching whether the XRP price can extend its recen...

Mark Zuckerberg’s Meta AI Predicts Unbelievable Bitcoin Price by the End of 2026
Mark Zuckerberg’s Meta AI predicts and stacks 4 numbered catalysts behind its Bitcoin price prediction that puts $120,000 to $150,...

Hyperliquid (HYPE) Price Prediction: Symmetrical Triangle Breakout Puts $77 Target Back in Focus
The breakout comes after several sessions of price compression, with HYPE continuing to trade within a broader technical structure...

Vitalik Buterin unveils “Lean Ethereum” roadmap for quantum resistance by 2029
Ethereum's proactive roadmap enhances its resilience and appeal, potentially boosting market confidence and investment in its futu...