XRP Price Dips Below Support – Is A Bearish Breakdown Now Underway?
XRP price started a fresh decline below $2.920. The price is now consolidating losses and might continue to move down if it trades below $2.850. XRP price is slowly moving lower below the $2.920 pivot zone. The price is...
Archive context
Older archive item. Useful for background and entity history, but not a fresh market-moving signal.

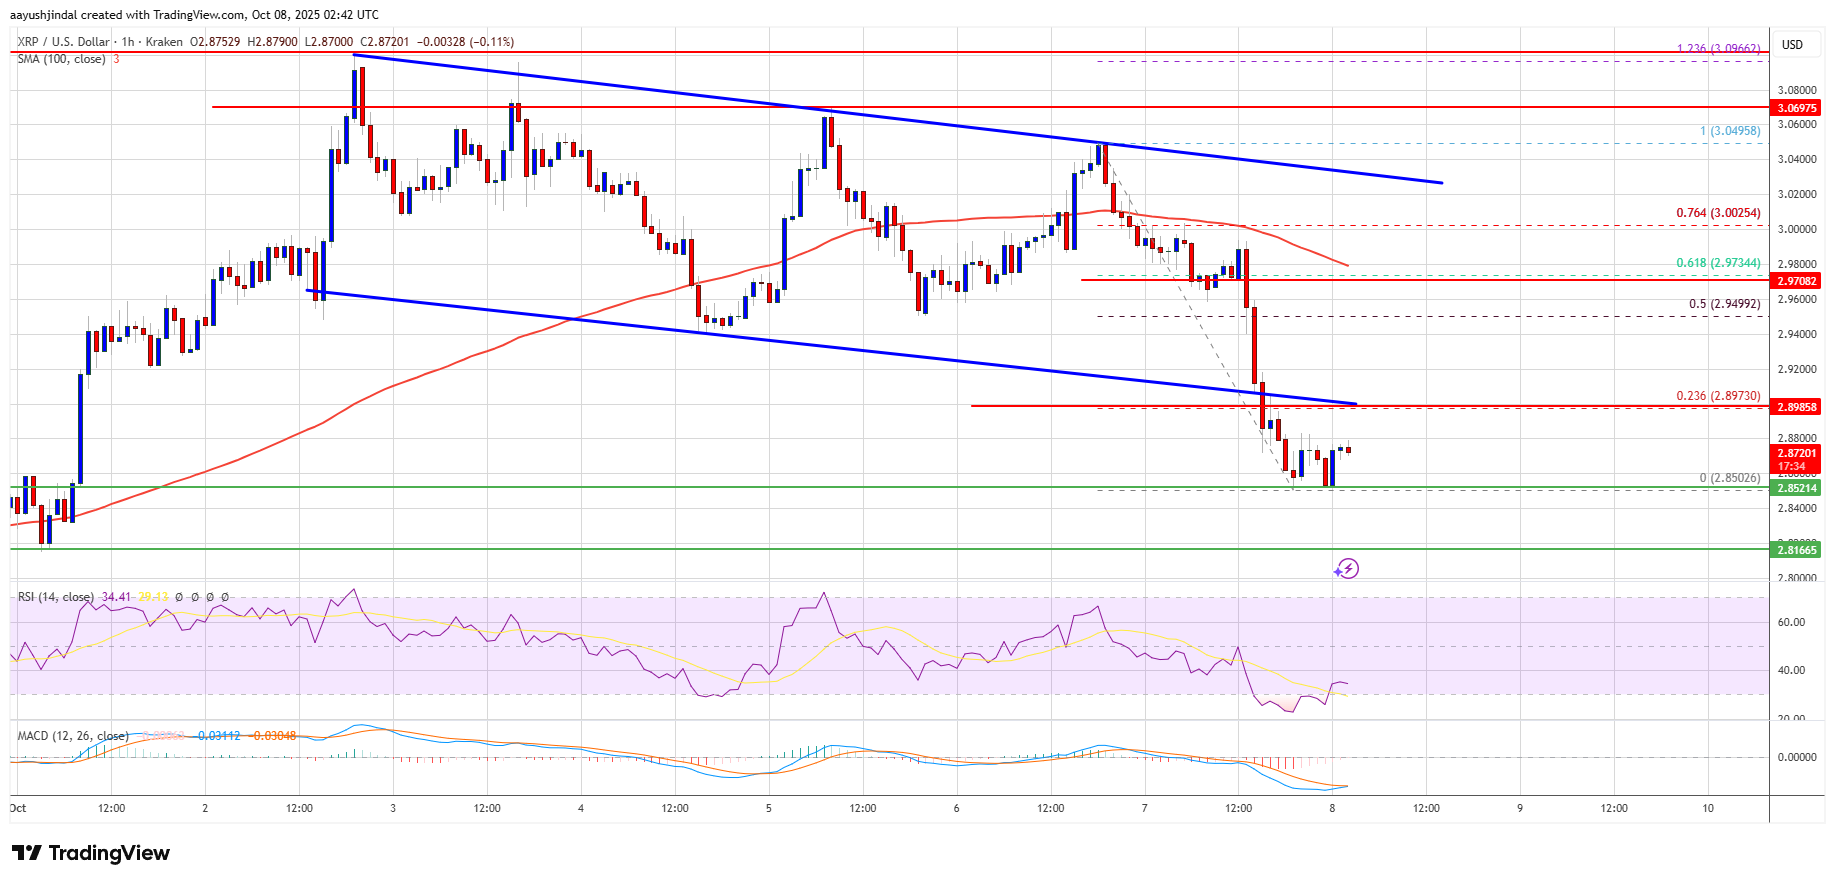
XRP price started a fresh decline below $2.920. The price is now consolidating losses and might continue to move down if it trades below $2.850.
- XRP price is slowly moving lower below the $2.920 pivot zone.
- The price is now trading below $2.950 and the 100-hourly Simple Moving Average.
- There was a break below a key declining channel with support at $2.90 on the hourly chart of the XRP/USD pair (data source from Kraken).
- The pair could start a fresh decline if it settles below $2.850.
XRP price failed to stay above $3.020 and started a fresh decline, like Bitcoin and Ethereum. The price declined below $3.00 and $2.950 to enter a short-term bearish zone.
Besides, there was a break below a key declining channel with support at $2.90 on the hourly chart of the XRP/USD pair. The price tested the $2.850 zone and is currently consolidating losses below the 23.6% Fib retracement level of the downward move from the $3.049 swing high to the $2.850 swing low.
The price is now trading below $2.920 and the 100-hourly Simple Moving Average. If there is a fresh upward move, the price might face resistance near the $2.90 level. The first major resistance is near the $2.950 level and the 50% Fib retracement level of the downward move from the $3.049 swing high to the $2.850 swing low.
A clear move above the $2.950 resistance might send the price toward the $3.00 resistance. Any more gains might send the price toward the $3.020 resistance. The next major hurdle for the bulls might be near $3.050.
Another Decline?If XRP fails to clear the $3.00 resistance zone, it could start a fresh decline. Initial support on the downside is near the $2.850 level. The next major support is near the $2.80 level.
If there is a downside break and a close below the $2.80 level, the price might continue to decline toward $2.7250. The next major support sits near the $2.650 zone, below which the price could continue lower toward $2.60.
Technical Indicators
Hourly MACD – The MACD for XRP/USD is now gaining pace in the bearish zone.
Hourly RSI (Relative Strength Index) – The RSI for XRP/USD is now below the 50 level.
Major Support Levels – $2.850 and $2.80.
Major Resistance Levels – $2.90 and $2.920.
Why this matters
This altcoin story adds another data point to the current market tape and is useful when read alongside nearby source coverage.
Original source
Read on NewsBTCRelated market context

XRP Price Prediction: XRP Faces Critical Resistance Near $1.17 Despite Ripple Securing Landmark EU License
While the company secured a full MiCA license that expands its operations across the European Economic Area, market indicators sug...

XRP Reclaims A Key Support Zone As Traders Watch Open Interest Build
XRP has moved back into a zone traders are watching closely, with the $0.50 area acting as the line that decides whether the lates...

US-Iran Strikes and $7.7B Stablecoin Exit Put Bitcoin at $62,870
In the latest Bitcoin news, Bitcoin saw BTC price drop to $62,870 on Wednesday after stalling at the $64,000 resistance zone, with...

Germany’s Bitcoin Wallet Nears The End Of Its Selloff Overhang
Germany’s seized Bitcoin wallet has been one of the market’s most obvious supply stories. Now the discussion is starting to change...

Sam Altman ChatGPT AI Predicts Insane Bitcoin Price by 2026
Sam Altman ChatGPT AI just circled November on the calendar and put a number next to Bitcoin Price Prediction. The model predicts...

Hedge Funds Are Most Bearish onYen Since 2007: Could Japan Rotation Send XRP to $2.00?
XRP News: XRP is trading around $1.07, down roughly 3% over the past 24 hours, but still carrying a 6–7% weekly gain that keeps th...