Bitcoin Forms Death Cross & TD-9 Sell Signal: Brace For Impact?
An analyst has explained how Bitcoin is forming both a death cross and TD sell signal, which may lead to potential dips in these targets. Bitcoin Looking In Trouble As 12-Hour Chart Forms Two Bearish Signals In a new pos...
Archive context
Older archive item. Useful for background and entity history, but not a fresh market-moving signal.

An analyst has explained how Bitcoin is forming both a death cross and TD sell signal, which may lead to potential dips in these targets.
Bitcoin Looking In Trouble As 12-Hour Chart Forms Two Bearish SignalsIn a new post on X, analyst Ali discussed two signals that have recently formed in Bitcoin’s 12-hour chart. The first of these is a “death cross,” which occurs when an asset’s short-term simple moving average (SMA) dips below its long-term SMA.
Regarding the death cross, the 50-day and 100-day SMAs make up for the short-term and long-term trend lines. Historically, such formations have been considered bearish signals, with the price potentially suffering once the pattern is confirmed.
The other signal that has appeared for the cryptocurrency involves the Tom Demark (TD) Sequential. This indicator is popularly used for finding locations of probable tops and bottoms in any asset’s price.
The TD Sequential has two phases: the “setup” and “countdown.” The first phase, the setup, is said to be complete once the asset has gone through nine candles of the same polarity. After these nine candles, the price may have reached a likely reversal point.
Naturally, if the candles in the setup’s formation were red, then the signal would be a buy one, while if the prevailing trend were bullish, the reversal would be towards the downside.
Once the setup is complete, the countdown phase begins. This phase works much like the setup, except that candles are counted up to thirteen instead of nine. After the countdown’s completion, the commodity may be assumed to have reached another potential top/bottom.
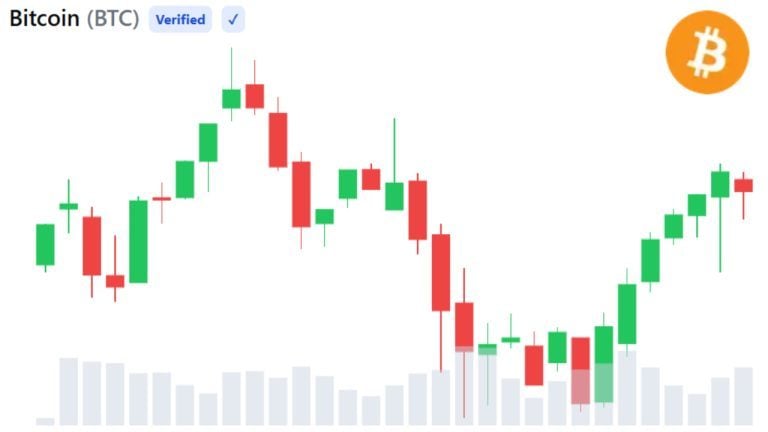
Now, here is the chart shared by Ali that highlights how signals about both of these technical analysis patterns have been witnessed in the 12-hour price of Bitcoin recently:
As is visible in the graph, the 12-hour price of Bitcoin first saw a death cross form with the 50-day SMA moving under the 100-day SMA. Then, it observed the completion of a TD Sequential setup, with the indicator suggesting a reversal to the downward direction.
Since this double bearish pattern has appeared, BTC has been heading down, suggesting that these signals may already be in effect. “If BTC falls below $63,300, brace for possible dives to $61,000 or even $59,000,” says the analyst.
From the current price of the cryptocurrency, a potential drawdown to the first of these targets would mean a decline of 4.6%, while one to the latter level would suggest a drop of nearly 8%.
BTC PriceSo far, Bitcoin has managed to prevent falls under the $63,300 target listed by the analyst, as it currently floats around $64,000.
Why this matters
This bitcoin story adds another data point to the current market tape and is useful when read alongside nearby source coverage.
Original source
Read on NewsBTCRelated market context
Whale Buying Hints at Bitcoin Bottom After Worst Month Since 2022 — 3 Signals to Watch
Three signals may determine whether bitcoin’s worst month since 2022 marks a bottom, as tighter central bank policy, inflation pre...

XRP Price Prediction: XRP Faces Critical Resistance Near $1.17 Despite Ripple Securing Landmark EU License
While the company secured a full MiCA license that expands its operations across the European Economic Area, market indicators sug...

US-Iran Strikes and $7.7B Stablecoin Exit Put Bitcoin at $62,870
In the latest Bitcoin news, Bitcoin saw BTC price drop to $62,870 on Wednesday after stalling at the $64,000 resistance zone, with...

Bitcoin ETFs draw $500M but weak demand leaves rebound exposed
US spot Bitcoin exchange-traded funds drew nearly $500 million across the last two trading sessions, giving traders their first cl...

China’s AI curbs could lead to cascading economic costs across crypto and traditional markets
China's AI restrictions may drive up costs globally, impacting crypto and traditional markets, while boosting interest in decentra...

Sam Altman ChatGPT AI Predicts Insane Bitcoin Price by 2026
Sam Altman ChatGPT AI just circled November on the calendar and put a number next to Bitcoin Price Prediction. The model predicts...